
Figures & data
Figure 1. Fog node in TEVAC.
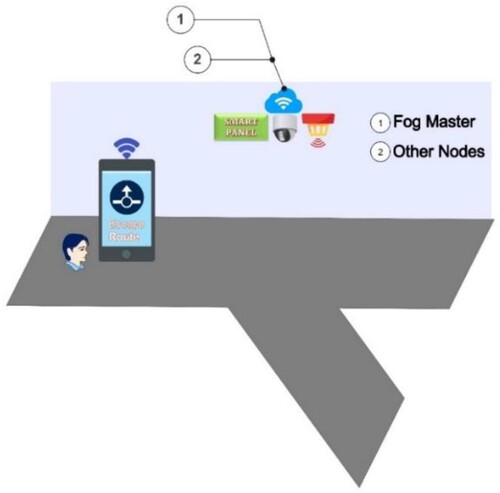
Table 1. Additional features of iTEVAC.
Figure 2. TEVAC based Fog computing.
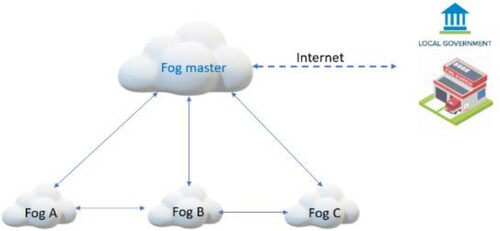
Figure 3. Indoor escape scene context.
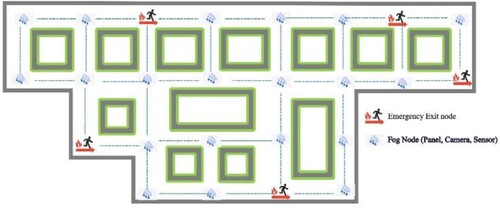
Figure 4. Graph based model.
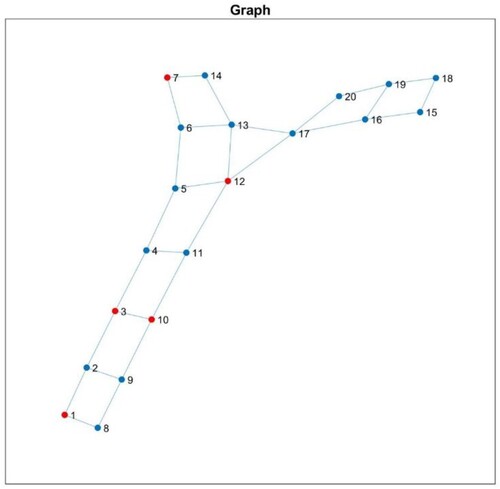
Figure 5. Overall architecture of Trusted Evacuation system.
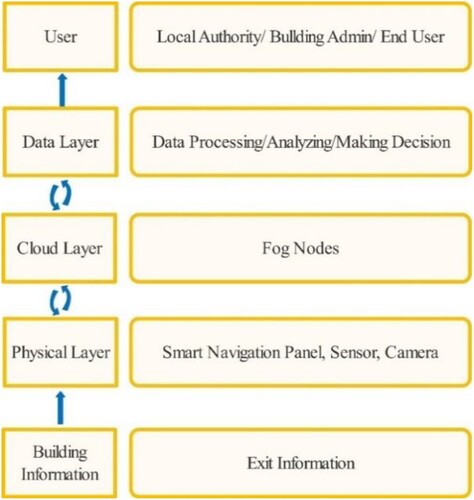
Figure 6. The iTEVAC process.
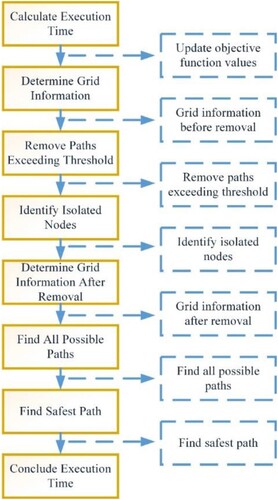
Table 2. Overall iTEVAC algorithm.
Table 3. Parameter values of the proposed algorithm.
Table 4. Scenario processing steps.
Table 5. Grid matrix representation of the commercial center’ nodes.
Figure 7. Sensor values received by the intelligent system at time t1.
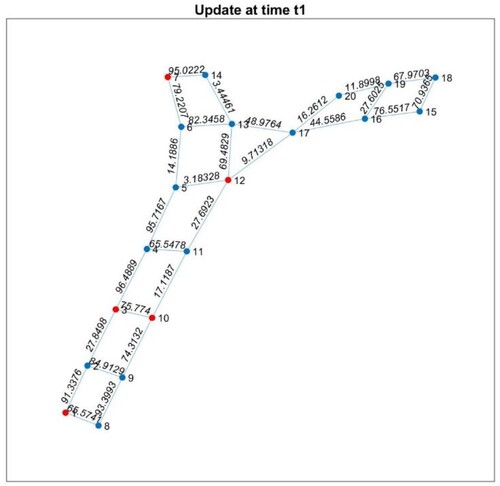
Table 6. Updated grid matrix reflecting changes in the network.
Table 7. Removing the hazardous paths in the grid matrix by replacing the values exceeding the threshold with the maximum value.
Figure 8. Separated grids.
Table 8. The value of optimal paths.
Table 9. The corresponding objective function values.
Table 10. Title optimal evacuation paths for nodes to nearest exits.
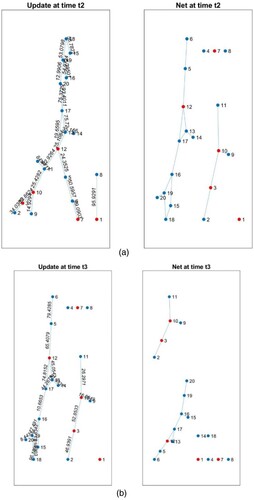
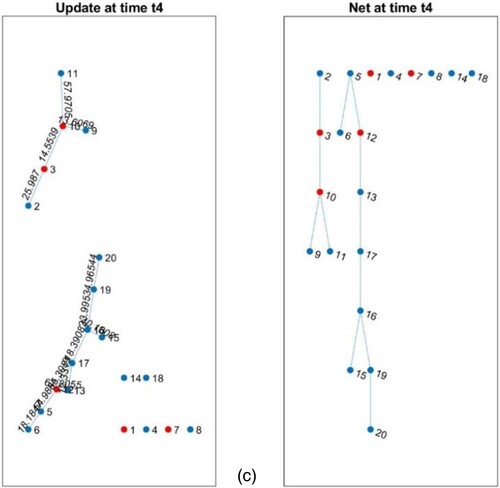
Figure 10. Comparison between iTEVAC and TEVAC.
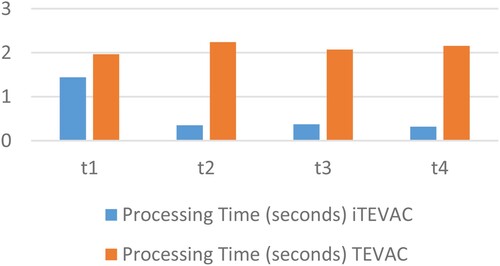
Table 11. Algorithm processing time in comparison between iTEVAC and TEVAC.
Table 12. Isolated nodes and proposed solutions.
Table 13. Movement directions and alerts at time t2 for each node.
Table 14. Movement directions and alerts at time t3 for each node.
Table 15. Movement directions and alerts at time t4 for each node.
Table 16. Comparative analysis of evacuation systems.