
Figures & data
Figure 1. Map of marijuana dispensaries in Denver, Colorado 2014–2016.
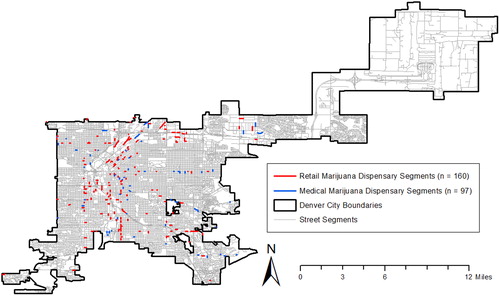
Figure 2. Spatial effect area development. The figure on the left depicts the Thiessen polygons generation process for every individual segment in the analysis. Each segment was assigned a center point, and the surrounding area was expanded into polygon form until the boundary became closer to a different segment. The blue polygons depict the spatial effects area around a recreational dispensary segment (yellow polygon). The figure on the right details the segments included in the spatial effects area analyses for each dispensary type (black segments). The black segments represent those those that are adjacent, spatial neighbors in a queen’s contiguity matrix to a dispensary segment (red).
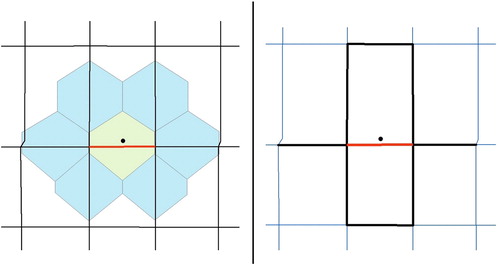
Table 1. Crime categories.
Table 2. Treated and weighted control area balance table.
Table 3. Recreational marijuana dispensaries local analysis.
Figure 3. Recreational marijuana local analysis property crime effect estimates.
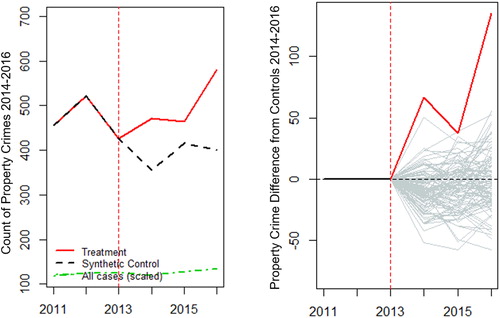
Table 4. Recreational marijuana dispensaries spatial effects analysis.
Figure 4. Recreational marijuana spatial effects analysis drug crime effect estimates.
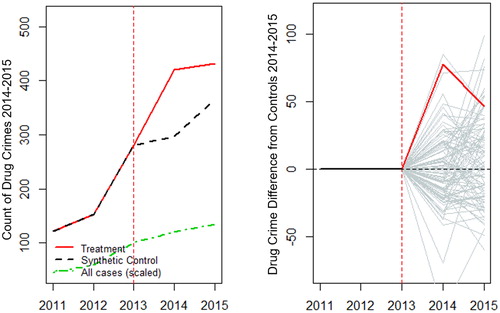
Figure 5. Recreational marijuana spatial effects analysis disorder crime effect estimates.
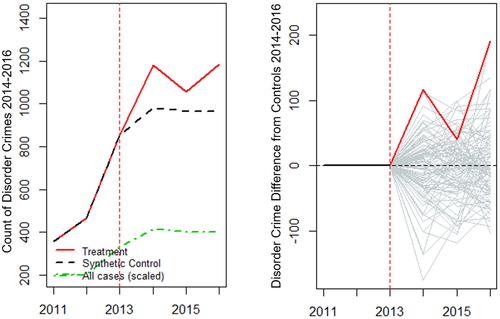
Table 5. Cost of Crime Incidents.
Table 6. Costs of crime increases and Denver marijuana revenue.
Table 7. Denver marijuana revenue and cost-benefit ratios.