
Figures & data
Table 1. Empirical size, normal errors.
Table 2. Empirical size, Student errors.
Figure 1. Comparison of power curves under model 1 of two different error terms at significant level α = 0.05. We set (N, K) = (20,000, 40), (40,000, 100) for DM test. N = 4800, 6200 for GL test. N = 7400, 9500 for ZH test.
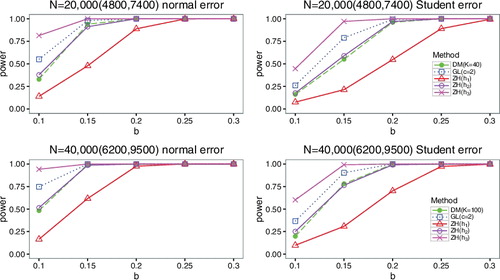
Figure 2. Comparison of power curves under low frequency of model 2 based on two different error terms at significant level α = 0.05.
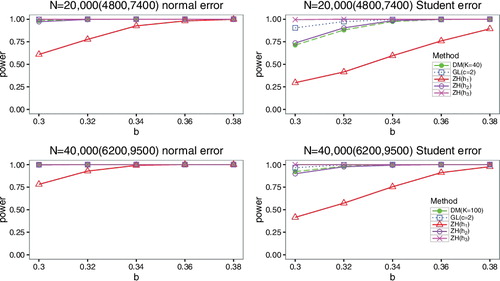
Figure 3. Comparison of power curves under high frequency of model 2 based on two different error terms at significant level α = 0.05.
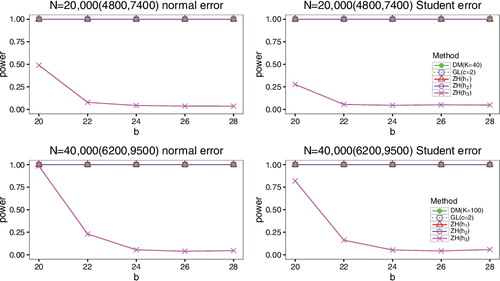
Table 3. Empirical power of DM test and ZH test based on the whole dataset when the error distribution is normal.
Table 4. Empirical power of DM test and ZH test based on the whole dataset when the error distribution is Student.