577
Views
14
CrossRef citations to date
0
Altmetric
Articles

Bayesian analysis of series system with dependent causes of failure

&
Pages 128-140 | Received 02 Jan 2017, Accepted 27 Jun 2017, Published online: 20 Jul 2017

Figures & data

Table 1. Possible reference prior of (α, θ1, θ2, θ3).

Table 2. The RB(%), CPs and RMSEs of the parameters when (α, λ0, λ1, λ2) = (0.5, 0.7, 1, 1.5).

Table 3. The RB(%), CPs and SRMSEs of the parameters when (α, λ0, λ1, λ2) = (1, 0.7, 1, 1.5).

Table 4. The RB(%), CPs and RMSEs of the parameters when (α, λ0, λ1, λ2) = (2, 0.7, 1, 1.5).

Table 5. Minimum time to blindness in days and its causes for 71 patients with diabetic retinopathy.

Figure 1. The Weibull probability plot.

Figure 1. The Weibull probability plot.

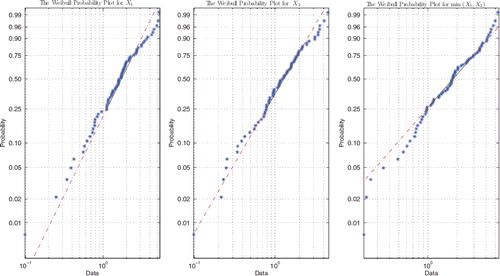
Table 6. The estimates of the parameters for the DRS data.

Reprints and Corporate Permissions

Please note: Selecting permissions does not provide access to the full text of the article, please see our help page How do I view content?

To request a reprint or corporate permissions for this article, please click on the relevant link below:

Academic Permissions

Please note: Selecting permissions does not provide access to the full text of the article, please see our help page How do I view content?

Obtain permissions instantly via Rightslink by clicking on the button below:

If you are unable to obtain permissions via Rightslink, please complete and submit this Permissions form. For more information, please visit our Permissions help page.