Figures & data
Figure 1. Part of a screenshot from the output generated by Reactome Skypainter using a specific list of genes. Each arrow represents a reaction and is coloured by the number of genes involved in that reaction.
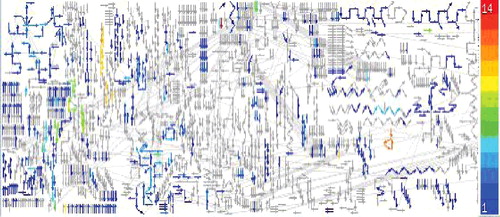
Figure 2. Comparison of the P value and the B value in the simulation study. The full list of genes (F) are denoted as lower case letters; the genes in the DE set D are (a, b, c, g, h, j, k, n, q, t, u). The rectangles contain the subset of genes annotated by each node, where the hypergeometric P values are listed under each rectangle, followed by the B values (The online version has a color figure).
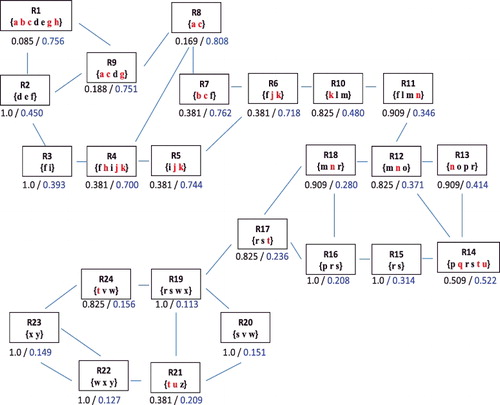
Table 1. Number of Reactome-sets identified in the P-list and the B-list.
Figure 3. The largest Reactome-set identified by both the P-list and the B-list. The rectangles denote the Reactome terms, where (mj, nj) are listed under each term, under which the P value and the B value are listed respectively, followed by the rank of the term by the P value and the rank by the B value (The online version has a color figure).
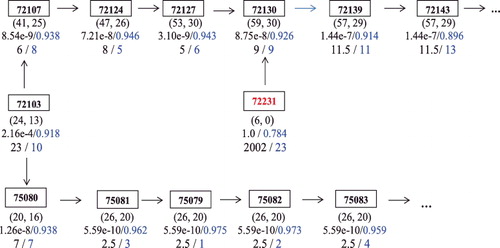
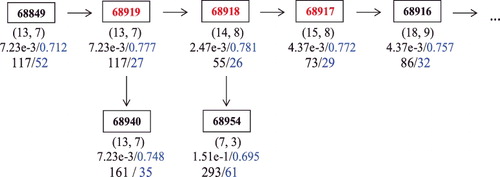
Figure 4. The neighbourhood of Reactome terms 68917, 68918 and 68919. The rectangles denote the Reactome terms, where (mj, nj) are listed under each term, under which the P value and the B value are listed respectively, followed by the rank of the term by the P value and the rank by the B value (The online version has a color figure).