Figures & data
Figure 1. Density function plots of the WEE distribution.
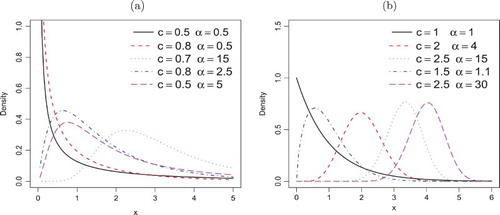
Figure 2. Hazard rate plots of the WEE distribution.
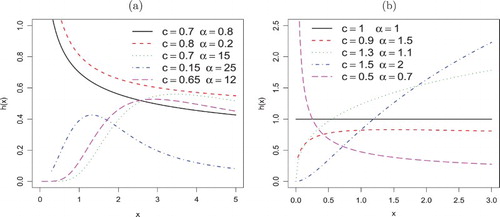
Figure 3. Skewness (a) and kurtosis (b) of X based on quantiles when .
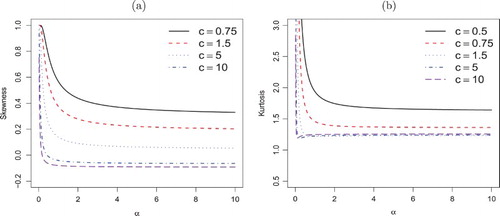
Table 1. Monte Carlo simulation results: Bias, MSE, CP, LB and UB.
Table 2. MLEs and their standard errors (in parentheses) for the guinea pigs data.
Table 3. MLEs and their standard errors (in parentheses) for the glass fibres data.
Table 4. The statistics AIC, BIC,  , , K–S and K–S p-value for the guinea pigs data.
Table 5. The statistics AIC, BIC, , , K–S and K–S p-value for the glass fibres data.
Figure 4. QQ-plot of data set 1.
Figure 5. QQ-plot of data set 2.
Figure 6. TTT plots (a) and (b) data sets 1 and 2.