Figures & data
Figure 1. The intrinsic discrepancy in (Equation8
(8) ) as a function of
for n=1, k=4 and
.
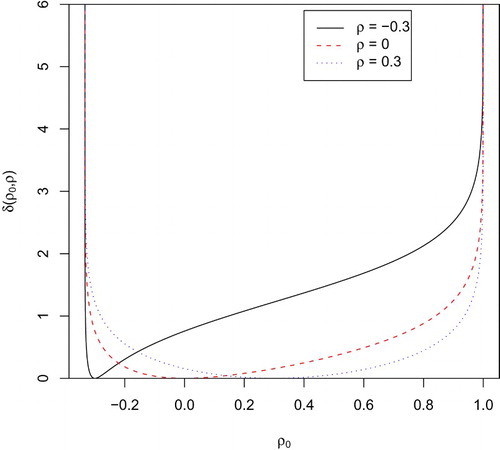
Table 1. The MAE of the Bayesian estimators for ρ based on 10,000 replications in the simulation study.
Table 2. The MAE of the MLE for ρ based on 10,000 replications in the simulation study.
Table 3. The estimated tail probabilities of posterior distributions based on 10,000 replications in the simulation study.
Figure 2. Sampling distribution of under
obtained from the 5000 simulations with
for different sample sizes when testing
.
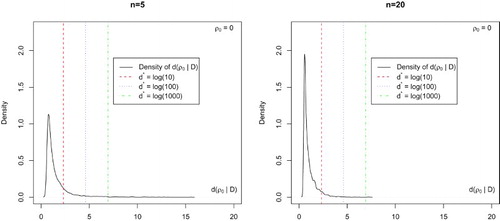
Figure 3. Sampling distribution of under
obtained from 5000 simulations with
for different sample sizes when testing
.
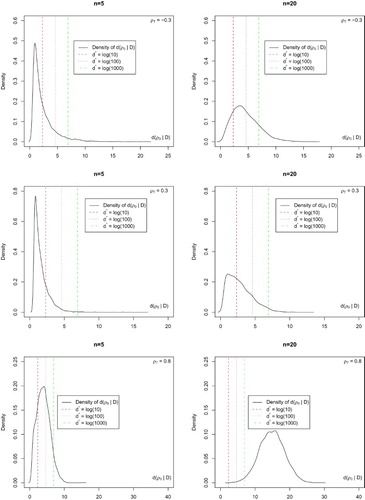
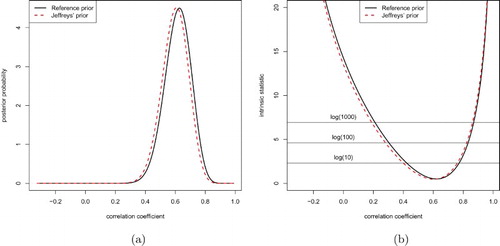
Figure 4. The marginal posterior density for ρ based on two objective priors (left), and the intrinsic statistic with the non-rejection regions corresponding to the threshold values (right) for the orthodontic data in Frees (Citation2004): (a) marginal posterior distribution and (b) intrinsic statistic.