Figures & data
Table 1. Estimates of parameters for three baseline survivals.
Figure 1. Estimated CIFs with Weibull distributions (solid lines), their 95% pointwise confidence intervals (dashed and dotted lines), and the true CIFs (dotdash lines). (a) . (b)
. (c)
. (d)
. (e)
. (f)
.
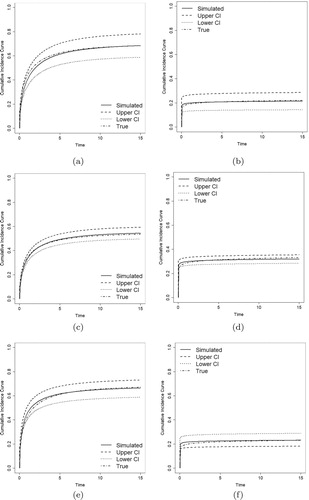
Figure 2. Estimated CIFs with lognormal distributions (solid lines), their 95% pointwise confidence intervals (dashed and dotted lines), and the true CIFs dotdash lines). (a) . (b)
. (c)
. (d)
. (e)
. (f)
.
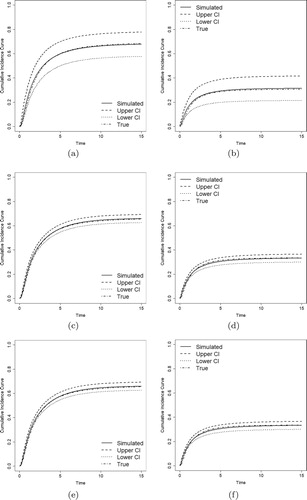
Figure 3. Estimated CIFs with Weibull and lognormal distributions (solid lines), their 95% pointwise confidence intervals (dashed and dotted lines), and the true CIFs (dotdash lines). (a) . (b)
. (c)
. (d)
. (e)
. (f)
.
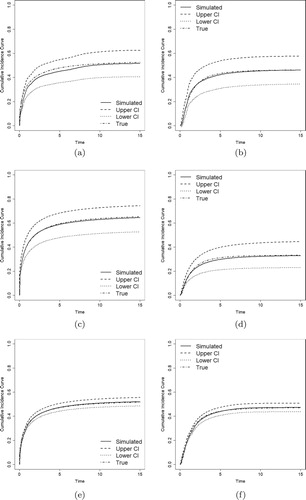
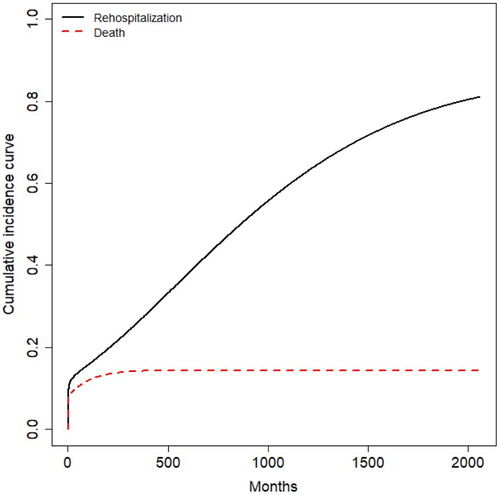
Table 2. Results for colorectal cancer clinical trial data.
Figure 4. Proposed model.