Figures & data
Figure 1. Boxplots of average model sizes for Example 4.1 under different group number.
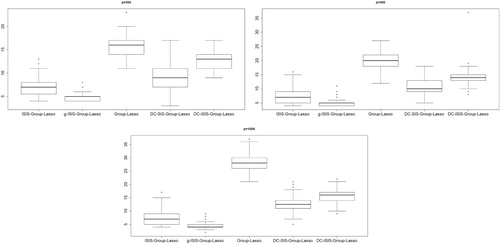
Table 1. Simulation results of MEDIAN, TP, FP, CORRECT and ME for Example 4.1.
Table 2. Simulation results of MEDIAN, TP, FP, CORRECT and ME for Example 4.2.
Table 3. Simulation results of MEDIAN, TP, FP, CORRECT and ME for Example 4.3.
Table 4. Simulation results of MEDIAN, TP, FP, CORRECT and ME for Example 4.4.
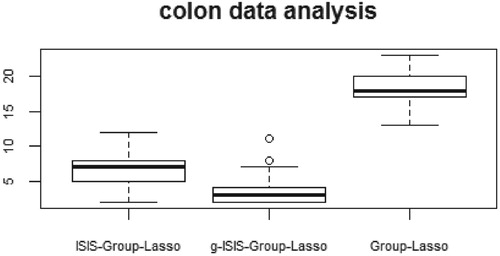
Figure 2. Boxplot of average model sizes for colon data analysis.