Figures & data
Figure 1. Simulation A with fixed domain effects: Relative bias (%) of domain mean estimators. Horizontal axis represents the different domains.
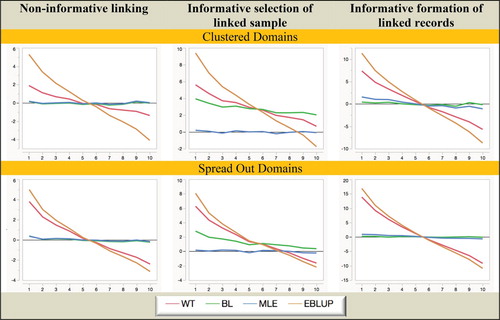
Figure 2. Simulation A with random domain effects: Relative bias (%) of domain mean estimators. Horizontal axis represents the different domains.
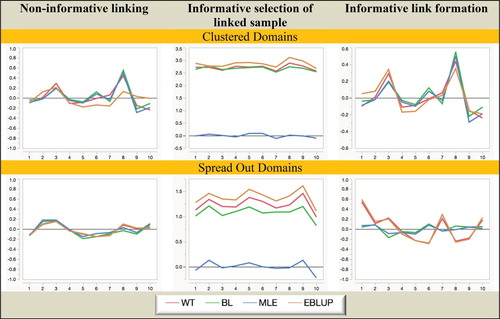
Figure 3. Simulation A with fixed domain effects: Relative RMSE (%) of domain mean estimators. Horizontal axis represents the different domains.
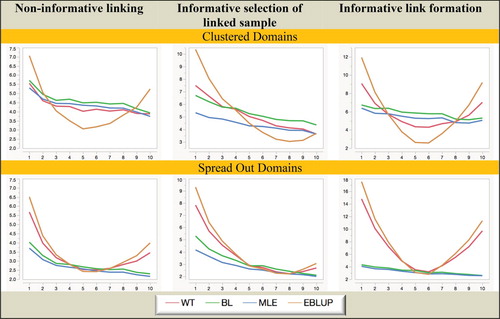
Figure 4. Simulation A with random domain effects: Relative RMSE (%) of domain mean estimators. Horizontal axis represents the different domains.
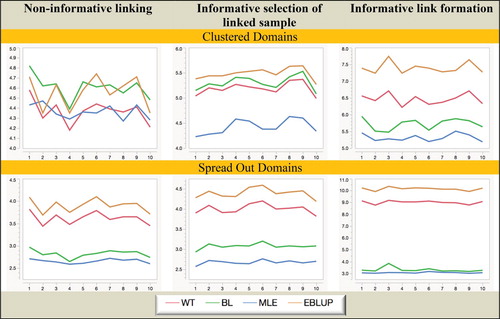
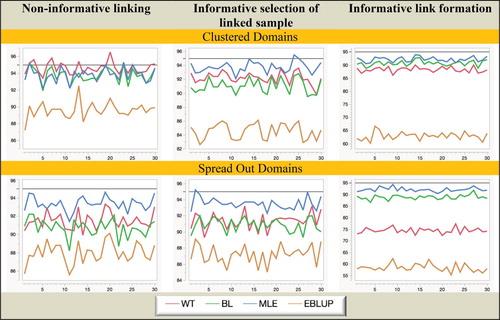
Figure 5. Simulation A with fixed domain effects: Coverage (nominal = 95%) of domain mean estimators. Horizontal axis represents the different domains.
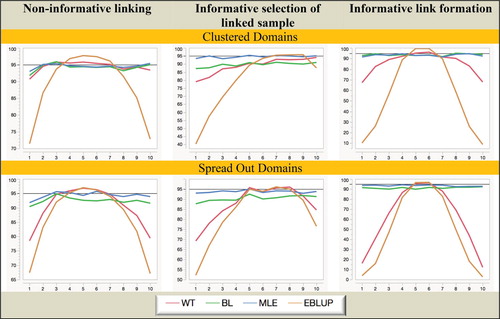
Figure 6. Simulation A with random domain effects: Coverage (nominal = 95%) of domain mean estimators. Horizontal axis represents the different domains.
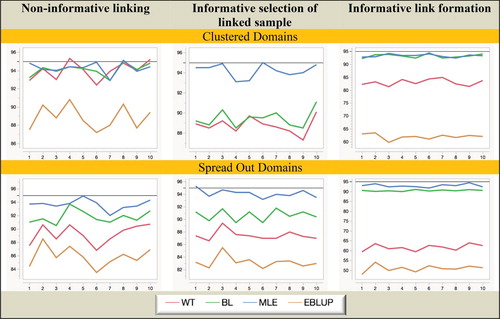
Figure 7. Simulation B with random domain effects: Relative Bias (%) of domain mean estimators. Horizontal axis represents the different domains.
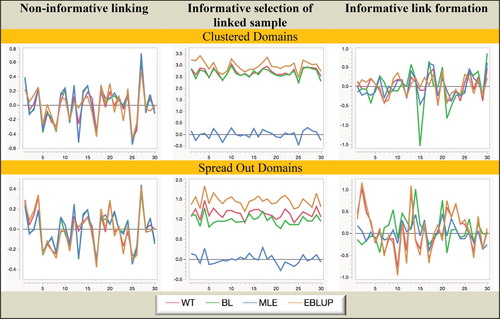
Figure 8. Simulation B with random domain effects: Relative RMSE (%) of domain mean estimators. Horizontal axis represents the different domains.
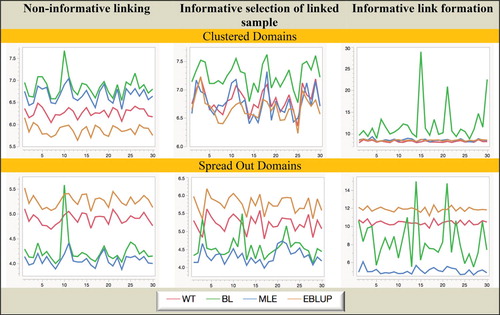
Figure 9. Simulation B with random domain effects: Coverage (nominal = 95%) of domain mean estimators. Horizontal axis represents the different domains.