Figures & data
Figure 1. This is for the ‘OBS’ case. The top two panels present the values of and
for 200 replications as n increases, respectively. The bottom two panels present the values of
and
for 200 replications as n increases, respectively.
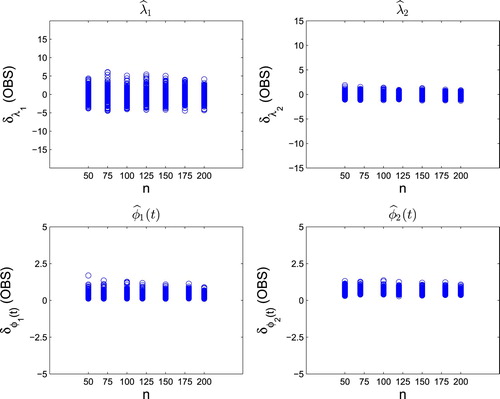
Figure 2. This is for the ‘SUBJ’ case. The top two panels present the values of and
for 200 replications as n increases, respectively. The bottom two panels present the values of
and
for 200 replications as n increases, respectively.
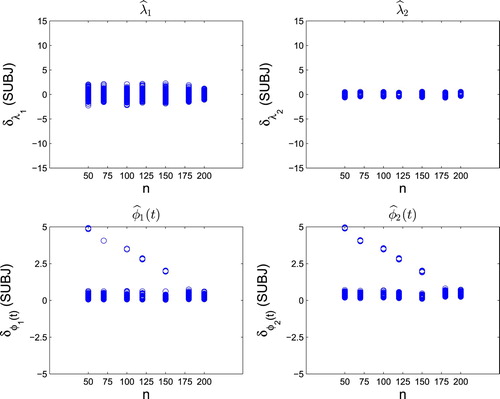
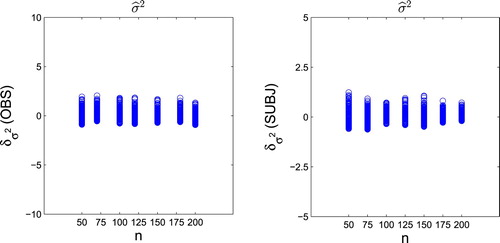
Figure 3. Plots of for ‘OBS’ (the left panel) and ‘SUBJ’ (the right panel), respectively.