Figures & data
Figure 1. Direct estimates of age-specific fertility rates at the national level, based on the 2008 Census and 2010 Demographic and Health Survey.
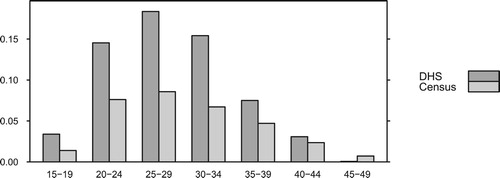
Figure 2. Direct estimates of age-specific fertility rates for eight selected provinces, based on the 2008 Census.
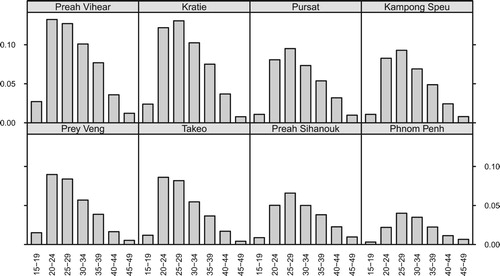
Figure 3. An overview of the model for births in Cambodia. Straight-edged rectangles represent demographic arrays and rounded rectangles represent models. Grey shapes are observed; everything else must be inferred.
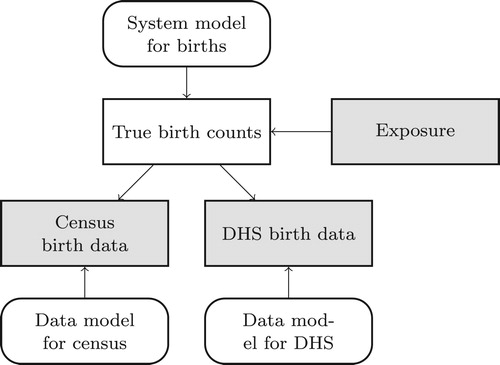
Figure 4. Estimates of age-specific fertility rates for eight selected provinces. The light grey bands represent 95% credible intervals, the dark grey bands represent 50% credible intervals, and the pale lines represent posterior medians. The black lines represent direct estimates from the census.
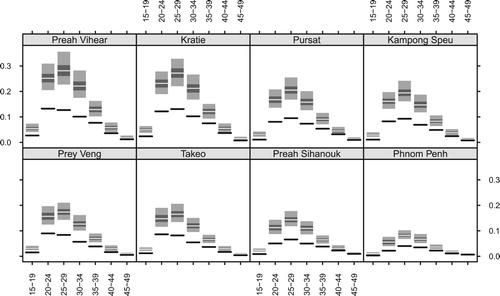
Figure 5. Estimates of age-specific fertility rates for the whole country. The black lines are direct estimates from the DHS.
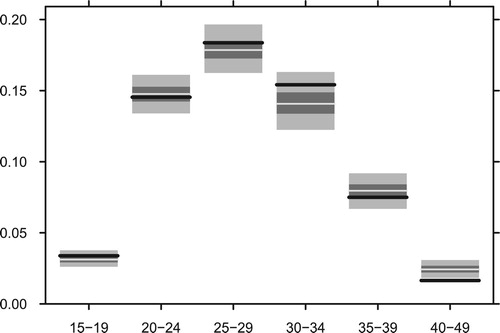
Figure 6. Estimates of coverage ratios for census data in eight selected provinces.
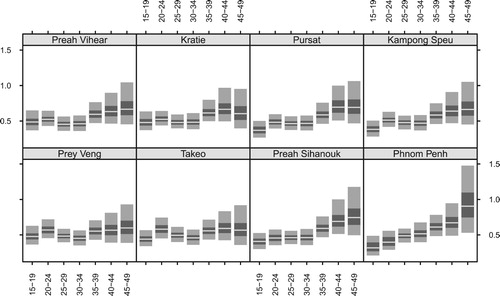
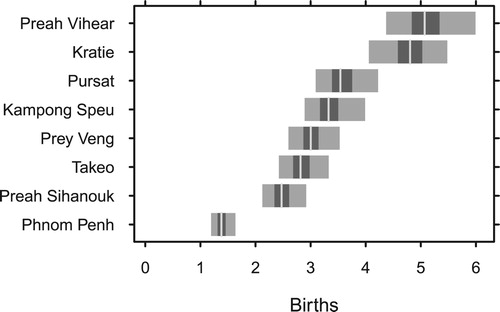
Figure 7. Estimates of total fertility rates for eight selected provinces.