Figures & data
Figure 1. Group information.
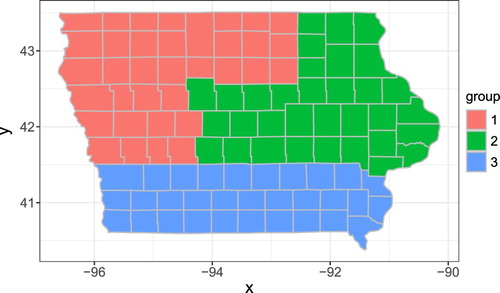
Figure 2. RMSE under Case I.
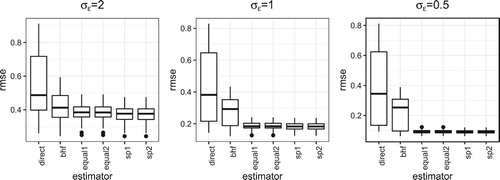
Figure 3. RMSE under Case II.
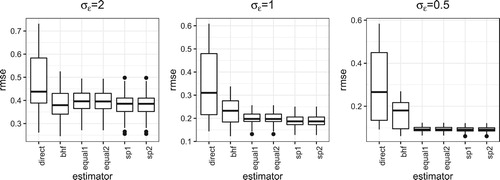
Figure 4. RMSE under Case III.
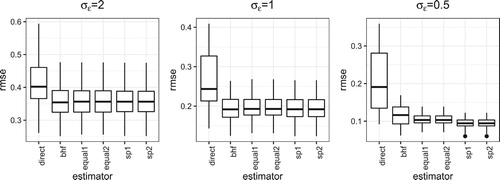
Figure 5. RMSE under Case I.
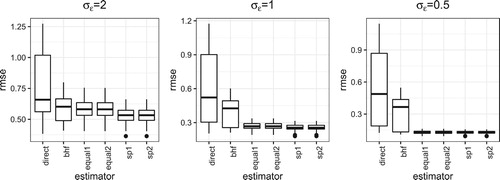
Figure 6. RMSE under Case II.
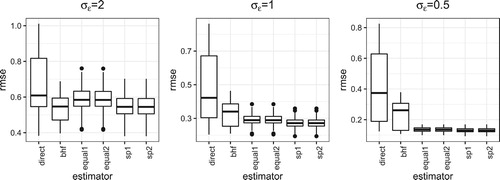
Figure 7. RMSE under Case III.
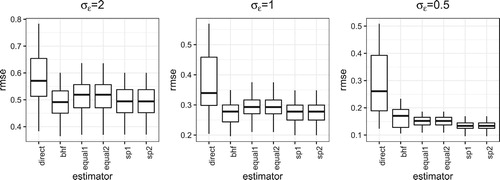
Figure 8. Estimated group structure.
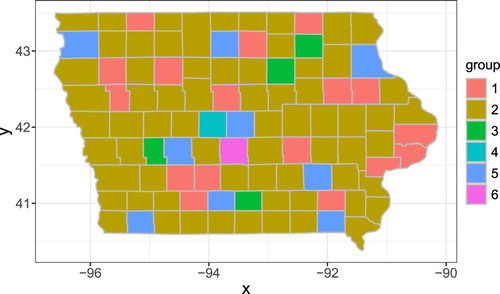
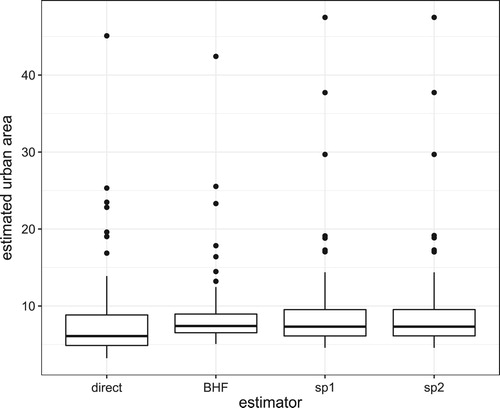
Figure 9. Estimated population mean of urban in each county.