Figures & data
Figure 1. U.S. population from 1900 to 2010.
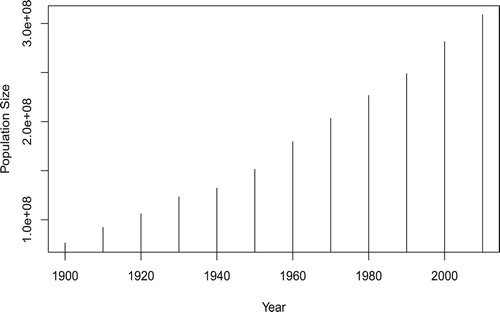
Figure 2. Logs of estimates of relvar plotted versus logs of population totals.
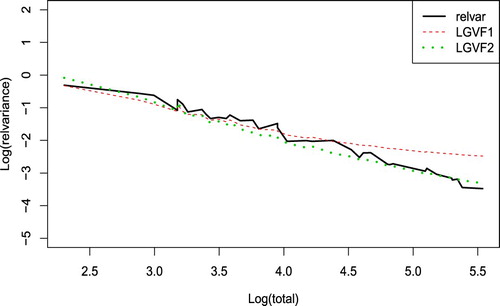
Figure 3. Ratio of the SEs (LGVF1–LGVF2/relvar) versus log (totals).
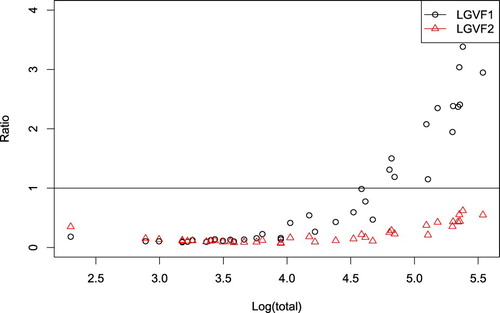
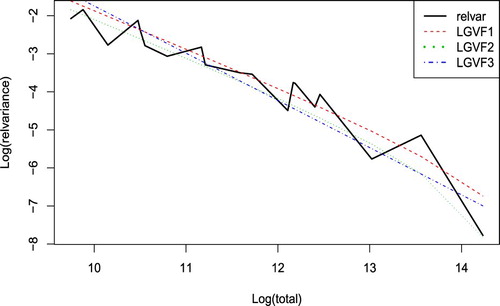
Figure 4. Logs of estimates of relvar plotted versus logs of population totals.
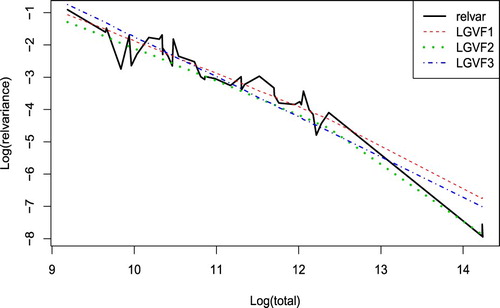
Figure 5. Ratio of the SEs (LGVF1–LGVF3/relvar) versus log(totals).
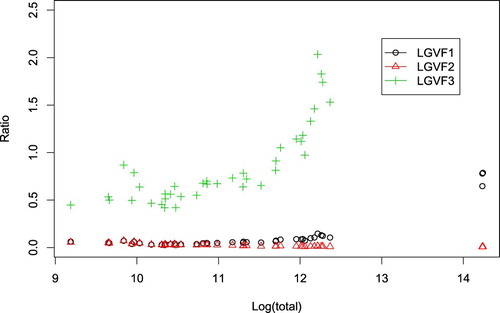
Figure 6. Logs of predicted relvar by using LGVF1–3 plotted versus logs of population totals (11 March).