
Figures & data
Figure 1. A scheme for 15 months parallel run.
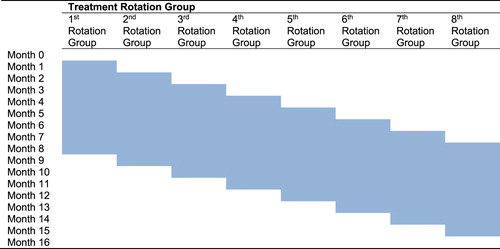
Figure 2. Average SE against treatment sample size, intra-cluster correlation and parallel duration.
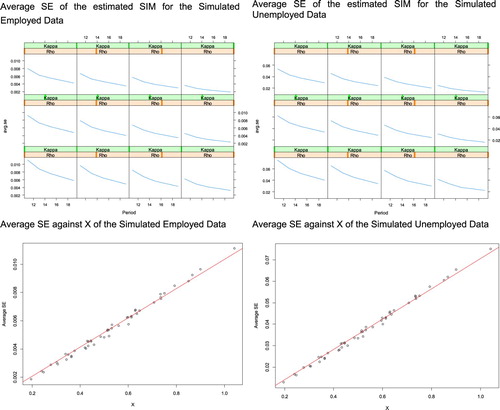
Table 1. Average SE Regress on X.
Table 2. Sample size and the length of the parallel run required for unemployment Options A and B.
Table 3. Total level shift detected by SSM across 100 replicates (Unemployed).
Table 4. Different parallel-run scenarios used in the simulationa.
Figure 3. Minimum detectable impact ratio at the 5% significance level and 50% power obtained with the times-series model for different periods after the changeover among the unemployed labour force (left panel) and the employed labour force (right panel).
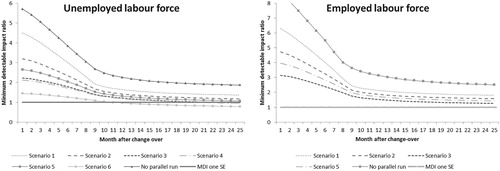
Table 5. The relative SEs for the impact measurement estimates and revisions for the unemployed labour force in percentage points after 12 months under different parallel-run options.
Table 6. The relative SEs for the impact measurement estimates and revisions for the employed labour force in percentage points after 12 months under different parallel-run options.
Figure 4. Comparisons of the initial SE from parallel run, final SE and revision after the 12-month changeover.
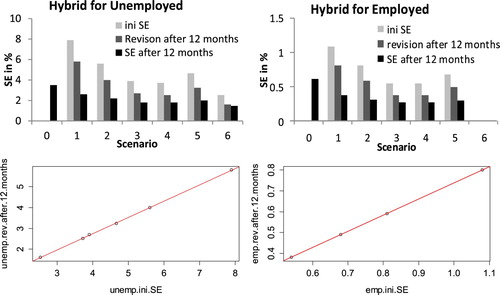
Table 7. Revision size regressing on ini SE.
Table 8. SE of final estimates regressing on ini SE.
Table
Table
Table
Table A1. Parameters for Simulation data generation
Table