Figures & data
Table 1. Relative bias and standard deviation for simulation 1 with true or estimated  and .
and .
Table 2. Relative bias and standard deviation for simulation 2 with true or estimated and .
Figure 1. Boxplots of observed annualised payment amount (in thousands) for overall, CCM group T = 1, and non-CCM group T = 0.
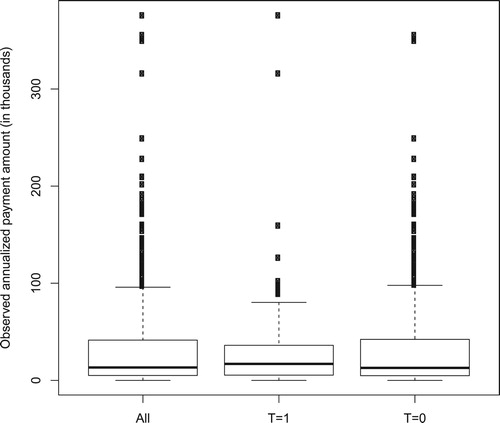
Table 3. Estimates and standard errors (SE) for the University of Wisconsin Health ACO data.
Figure A1. Five choices of in the space of all linear combinations of X. For
and
, the first row are
for estimating
characteristics, the second row are
for estimating
characteristics.
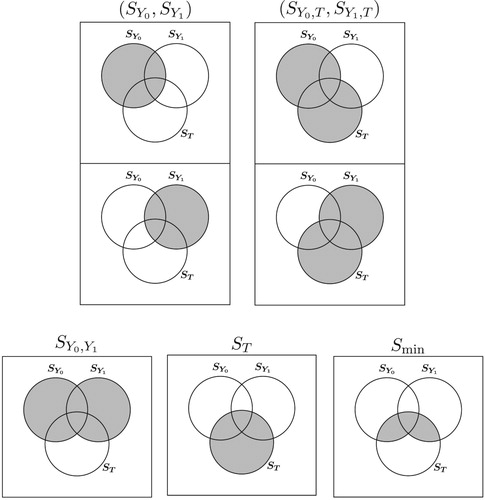
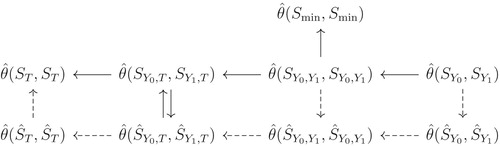
Figure A2. Relative efficiencies of estimators. Solid arrow from A to B means that A is more asymptotically efficient than B. Dashed arrow from A to B means that empirically A is more efficient than B.