Figures & data
Table 1. Benchmarked monthly area estimates  . CPS State estimates, ACS area estimates.
Figure 1. Annual ACS & CPS estimates, 2002–2016.
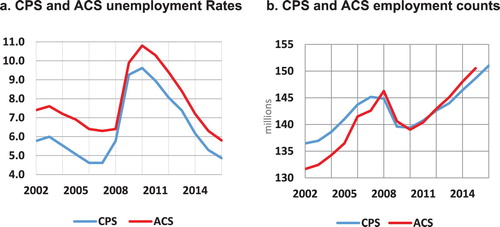
Figure 2. Annual ACS (y) and CPS(x) State shares of annual national totals.
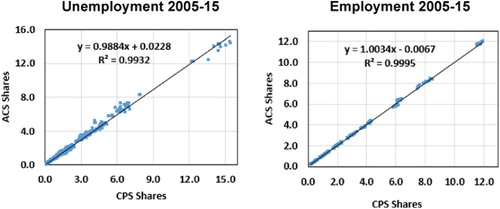
Figure 3. Monthly State CPS CVs (before modelling) and annual ACS CVs, 2005–2016.
Figure 4. Standard errors of change in monthly CPS and annual ACS, 2005–2016.
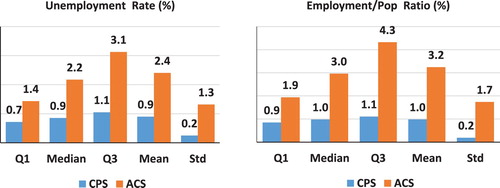
Figure 5. Autocorrelations of model residuals with approximate 95% confidence intervals.
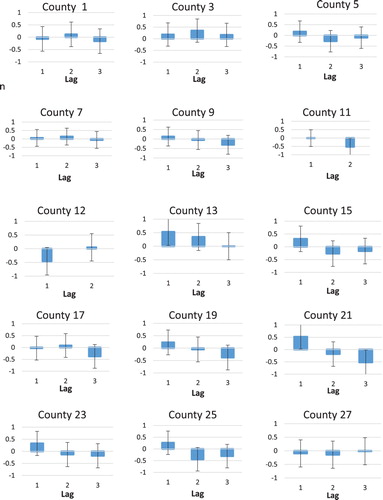
Table 2. Information about counties (sub-States) in the State of Arizona.
Table 3. Model (6) parameter estimates, Arizona.
Figure 6. Diagnostics based on Conditional Pearson Residuals (CPR).
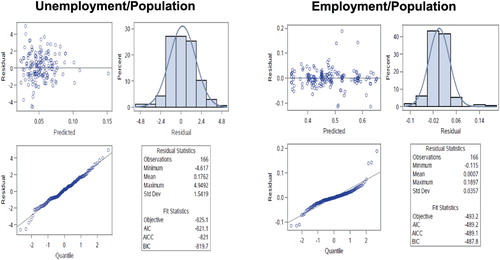
Figure 7. Annual unemployment rates for Yuma where the ACS estimates and the model-based ACS predictions are adjusted to the annual model-based CPS.
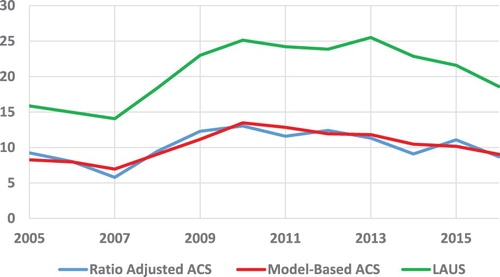
Figure 8. Unemployment rate estimates for Yuma County as obtained by HB, LAUS, Denton LAUS (DLAUS) and benchmarked Denton LAUS (BMK DLAUS). 2005–2016.
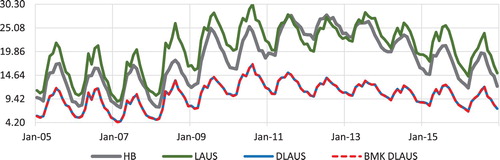
Figure 9. Unemployment Rate estimates for Yuma county: Synthetic, Dsynthetic, BMK Dsynthetic and BMK DLAUS. 2005–2016.
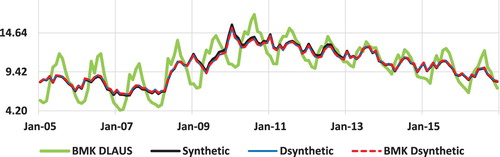
Table 4. Average absolute percent change between input series and benchmarked estimates. Arizona, all counties. 2005–2016.
Table 5. Model and Bootstrap (BS) Standard Errors (SE), and Coefficients of Variation (CV) for Arizona Unemployment by county, averaged over all monthly values. 10,000 Bootstrap samples. 2005–2016.
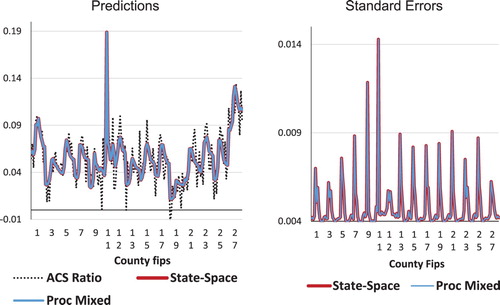
Figure A1. Predictions of annual ACS ratios () and standard errors as obtained from state-space modelling and Proc Mixed. 2005–2016.