Figures & data
Figure 1. Posterior plots with the prostate cancer data.
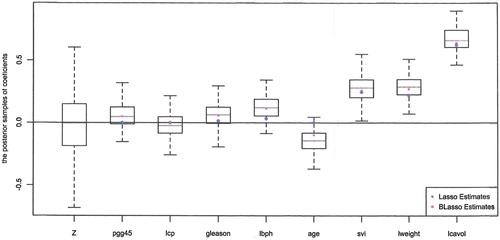
Table 1. Values of  and BIC in prostate cancer example.
Table 2. Results for simulation Study 1.
Table 3. Results for simulation Study 2.
Table 4. Results based on 100 random splits for the prostate cancer example.
Table 5. Results based on 100 random splits for the CCT8 example.
Table 6. Results based on 100 random splits for the OWB example.
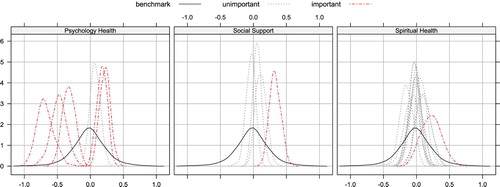
Figure 2. The posteriors of regression coefficients in three groups.