Figures & data
Table 1. Simulation results for parametric estimates with binary data.
Table 2. Simulation results for parametric estimates with count data.
Table 3. MISE for nonparametric estimate with binary data.
Table 4. MISE for nonparametric estimate with count data.
Figure 1. Estimate of nonparametric function (real line) and its 95% pointwise confidence interval (dashed line).
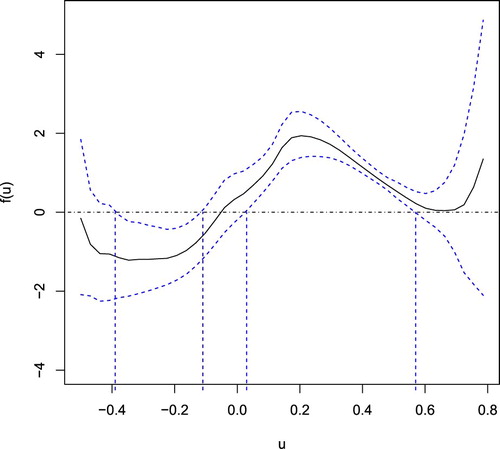
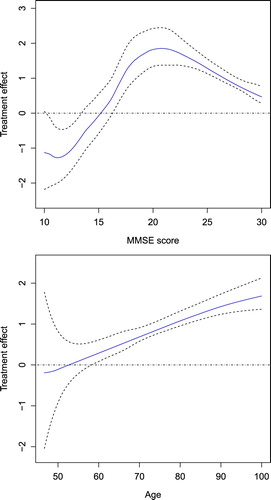
Figure 2. Relationship of treatment effect with MMSE score and Age: the estimated curve represented by real line and the corresponding 95% pointwise confidence interval by dashed line.