Figures & data
Table 1. D-optimal design for three-parameter logistic models.
Figure 1. Dose–response curves in the simulation.
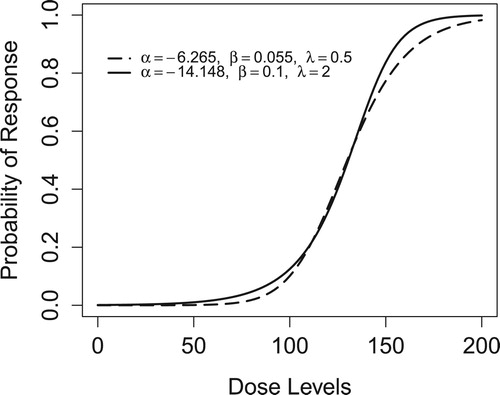
Table 2. RMSEs when fitting data from three-parameter logistic models under a number of designs.
Table 3. RMSEs when fitting three-parameter model to data from two-parameter model.
Table 4. RMSEs when fitting three-parameter model to data from three-parameter model.
Table 5. RMSEs when fitting three-parameter model to data from probit model.
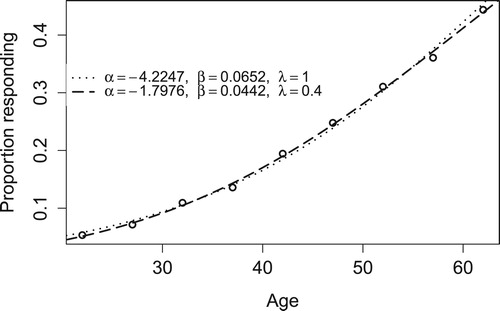
Figure 2. Observed data and fitted curves for British coal miners.