
Figures & data
Table 1. A decision table for a ‘3+3+3’ design (target toxicity is 0.3).
Table 2. Rejection regions and decision rules.
Figure 1. Schema of dose-finding using decision table. is the cumulative number of subjects treated at dose level i;
is the maximum number of subjects allowed at any dose level; d is the total number of dose levels. ‘treat more patients’ means additional cohort of patients should be treated to evaluate DLT. After that, it should go back to Step 1.
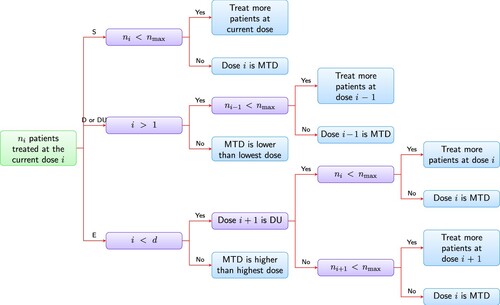
Figure 2. True toxicity curves and their distributions.
