Figures & data
Figure 1. Euro dollar against US dollar exchange rate hourly maxima of 1 min (left panel) and 5 min (right panel) negative returns. The x-tickers are (h0 - (12:00 AM- 1:00 AM), h1 - (1:00 - 2:00 AM), …, h23 (11:00 PM - 11:59 PM) from left to right, respectively.
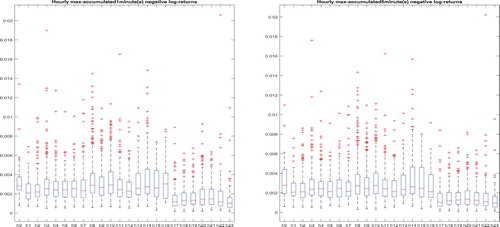
Table 1. The asymptotic dependence index , and
.
Table 2. MLE for cross-sectional maxima of negative standardised daily log-returns for DJI30 from 1 January 2000 to 21 March 2020.
Figure 2. Estimated tail indexes (left) and scale parameters
(right) from 1 January 2000 to 21 March 2020 for Dow Jones 30.
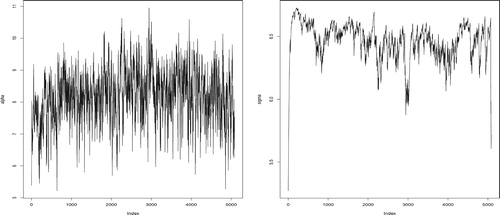
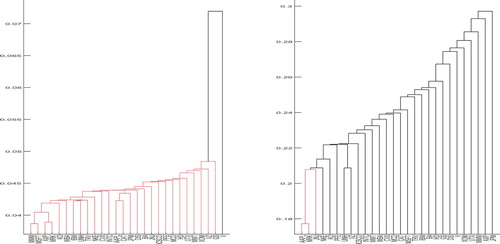
Figure 3. Dendrograms based on TQCC (left) and linear correlation coefficients (right) using the complete linkage.
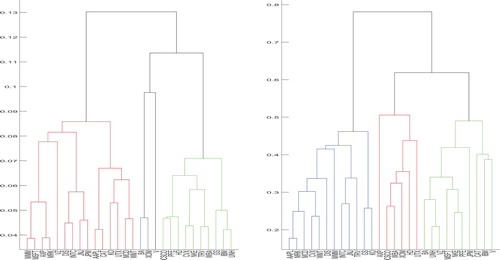
Figure 4. Dendrograms based on TQCC (left) and linear correlation coefficients (right) using the single linkage.