Figures & data
Table 1. for normal mixture
.
Table 2. for normal mixture
.
Table 3. for normal mixture
.
Figure 1. Boxplots of the relative values RE for the bandwidth selectors for the estimation of densities and
. The sample size varies from 100 to 2000.
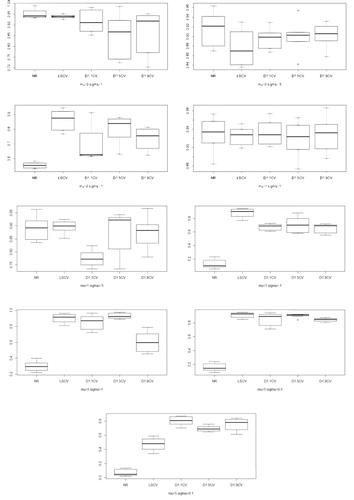
Table 4. for lognormal mixture
.
Table 5. for lognormal mixture
.
Table 6. for lognormal mixture
.
Figure 2. Estimated density of per capita in 2008 using the different bandwidths.
(solid line);
(dashed line);
(dotted line);
, (dotdash line) and
(longdash line).
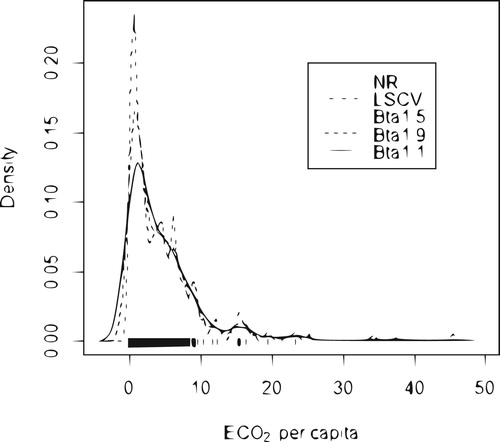
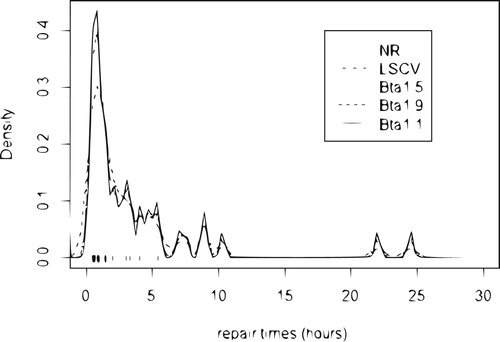
Figure 3. Estimated density of repair times (hours) for an airborne communication transceiver: (solid line);
(dashed line);
(dotted line);
, (dotdash line) and
, normal reference (longdash line).
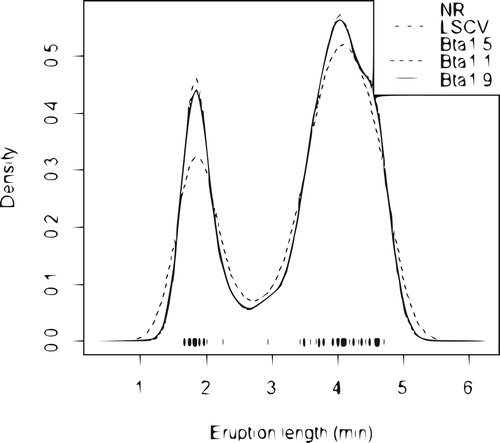
Figure 4. Estimated density of repair times (hours) for an airborne communication transceiver using the different bandwidths: (solid line);
(dashed line);
(dotted line);
, (dotdash line) and
, normal reference (longdash line).