
Figures & data
Figure 1. Daily closing prices of SSE Index from 01/05/2005 to 10/20/2020.
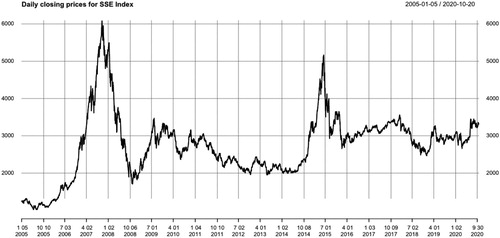
Figure 2. Histogram of daily maxima of negative log-returns of 87 stocks in SSE Index from 01/05/2005 to 10/20/2020.
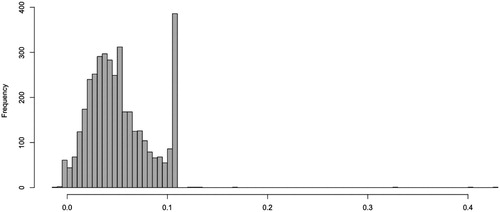
Figure 3. Daily maxima of standardised negative log-returns of 87 stocks in SSE Index from 01/05/2005 to 10/20/2020.
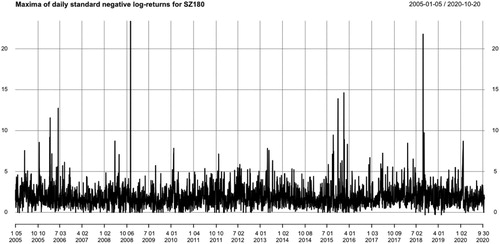
Figure 4. Histogram of daily maxima of standardised negative log-returns of 87 stocks in SSE Index from 01/05/2005 to 10/20/2020.
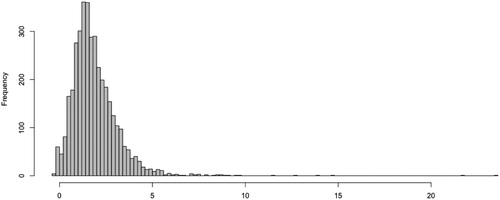
Table 1. MLE for cross-sectional daily maxima of negative log-returns of 87 stocks in SSE Index from 01/05/2005 to 10/20/2020.
Figure 5. Recovered tail indexes (dashed), and daily maxima of standardised negative log-returns (solid) of 87 stocks in SSE Index from 01/05/2005 to 10/20/2020.
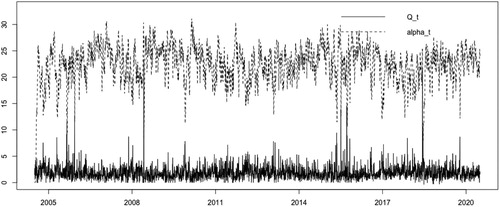
Figure 6. Recovered scale parameters of 87 stocks in SSE Index from 01/05/2005 to 10/20/2020.
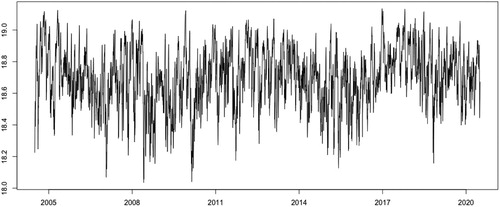
Figure 7. The 5% quantile (dashed), 95% quantile (dash-dotted) of the estimated and daily maxima of standardised negative log-returns (solid) of 87 stocks in SSE Index from 01/05/2005 to 10/20/2020.
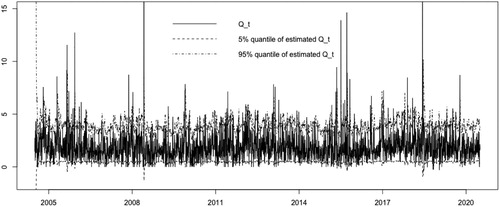
Table 2. The performance of model (5.1)–(5.3) on approximation of 1-day conditional VaR for daily maxima negative log-returns of SSE Index.