
Figures & data
Figure 1. Graph illustration for target toxicity tolerance probability in Theorem 2.3. (a) The target toxicity tolerance probability θ in system ; (b) The target toxicity tolerance probability
in system
.

Figure 2. Graph illustration for in Theorem 2.3, where
. (a)
in system
; (b)
in system
.
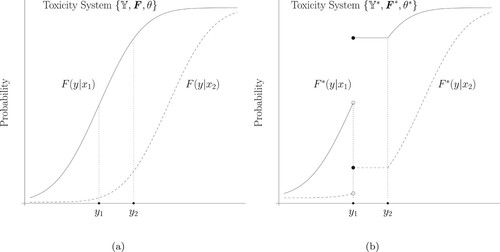
Figure 3. Graph illustration for (a) the target toxicity tolerance probability with form (Equation10(10)
(10) ) and (b) the negative derivative curve of the target toxicity tolerance probability.
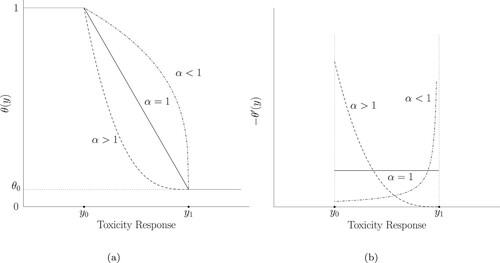
Table 1. An Illustration of Proposition 3.3. The parameters for the true model are ,
and
. The parameters for the target toxicity tolerance probability are
,
and
.
Table 2. Setting of simulation study for the normal toxicity response.
Table 3. Simulation results by generating 200 data sets for each scenario: each cell consists of two values , where s is the percentage that the dosage
is recommended as an MTD, and t a percentage that the dosage is used in the experiment to search for the MTD. For each row, the dosage with largest percentage in MTD selection is boldfaced.
Figure 4. Graph illustrations for the functions discussed in Table .
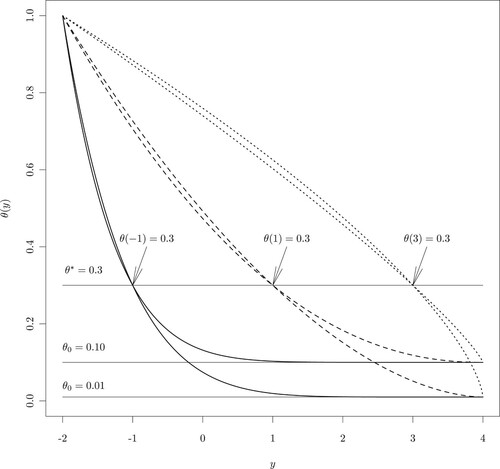
Table 4. Choices for the target toxicity tolerance probability functions by (Equation10(10)
(10) ).
Table 5. Simulation results of the recommended MTD levels, as well as dosage allocation percentages for different choices of and
.
Table 6. Simulation results of the recommended MTD levels, as well as dosage allocation percentages for ‘dichotomous’ cases. Two decision criteria are employed: criterion I is to choose next dosage level at a nearest dose, and criterion II is to choose next dosage level at the lower bound.