
Figures & data
Table 1. Estimation and prediction results for key parameters and the epidemic trends.
Figure 1. Fitting for the selected growth model by countries. The fitted growth curve (solid) and the actual number (dotted) of daily confirmed cases over the ordered days of the outbreak (I).
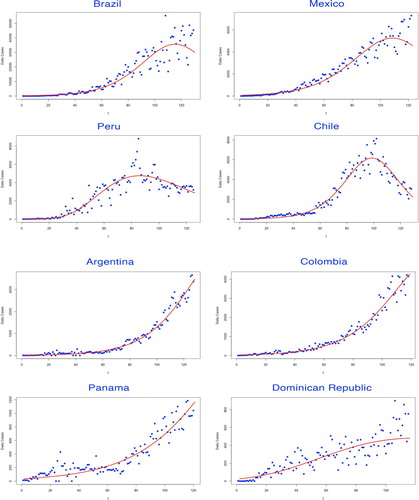
Figure 2. Fitting for the selected growth model by countries. The fitted growth curve (solid) and the actual number (dotted) of daily confirmed cases over the ordered days of the outbreak (II).
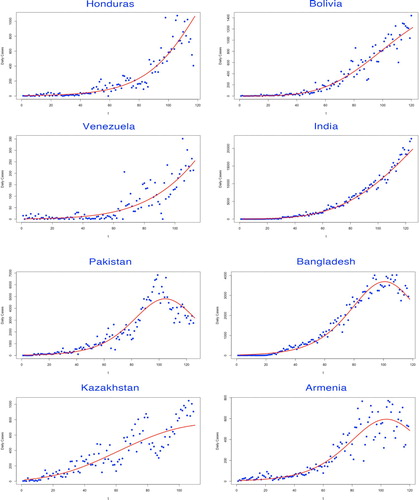
Figure 3. Fitting for the selected growth model by countries. The fitted growth curve (solid) and the actual number (dotted) of daily confirmed cases over the ordered days of the outbreak (III).
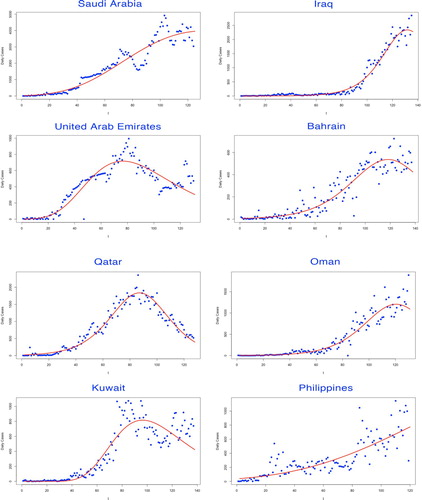
Figure 4. Fitting for the selected growth model by countries. The fitted growth curve (solid) and the actual number (dotted) of daily confirmed cases over the ordered days of the outbreak (IV).
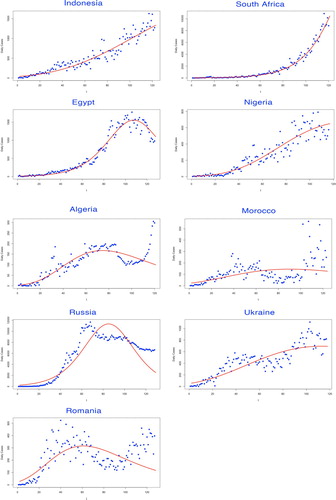
Table 2. Parameters of growth models for estimating basic reproduction number.
Figure 5. Prediction error versus infectious period by countries (I).
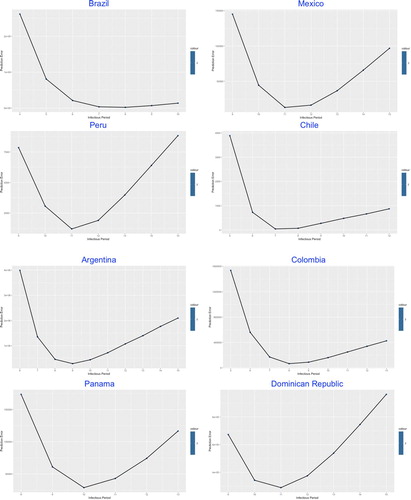
Figure 6. Prediction error versus infectious period by countries (II).
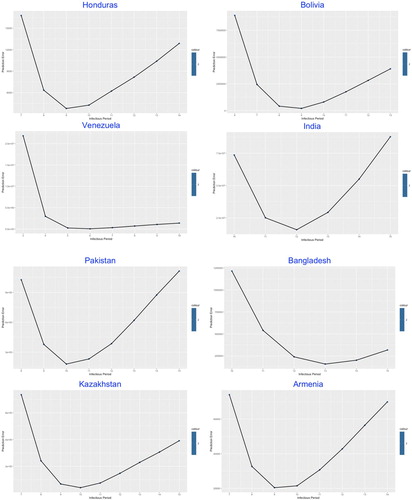
Figure 7. Prediction error versus infectious period by countries (III).
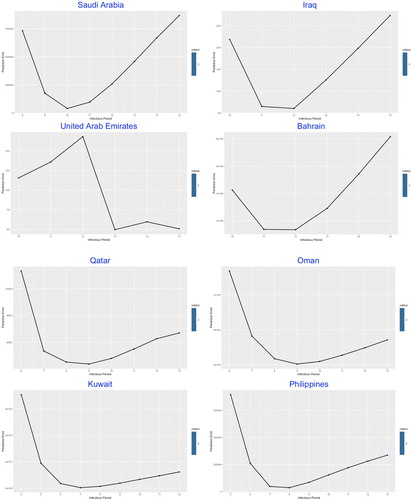
Figure 8. Prediction error versus infectious period by countries (IV).
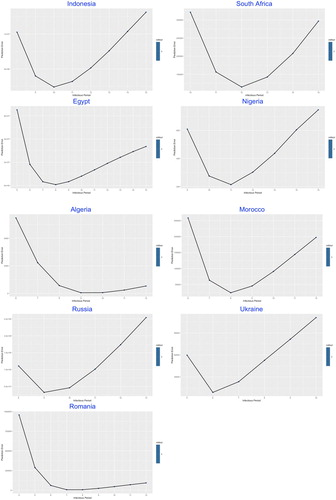
Figure 9. SIR-X model fitting by countries. The fitted growth curve (red-solid, smooth) and the actual growth curve (blue-solid, discretised) of daily confirmed cases over the ongoing dates of the outbreak. The predicted trajectory (green-solid) forecasts the daily growth of 100 days after the end of the study period (I).
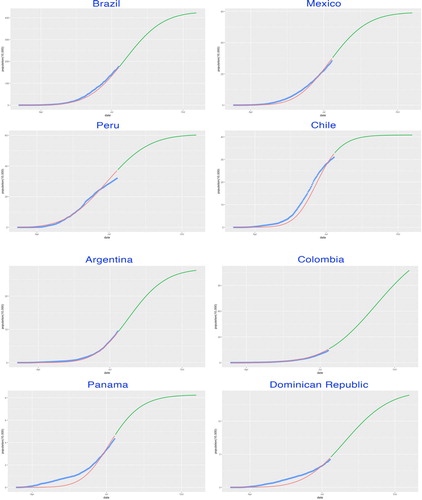
Figure 10. SIR-X model fitting by countries. The fitted growth curve (red-solid, smooth) and the actual growth curve (blue-solid, discretised) of daily confirmed cases over the ongoing dates of the outbreak. The predicted trajectory (green-solid) forecasts the daily growth of 100 days after the end of the study period (II).
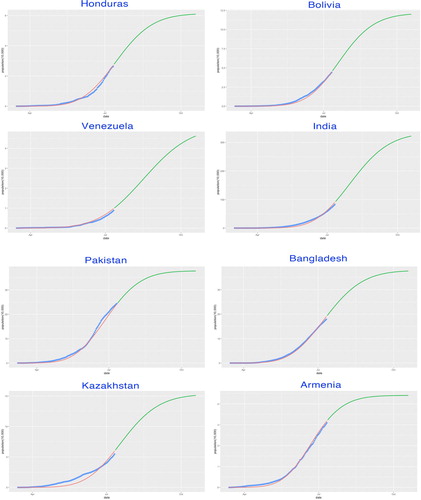
Figure 11. SIR-X model fitting by countries. The fitted growth curve (red-solid, smooth) and the actual growth curve (blue-solid, discretised) of daily confirmed cases over the ongoing dates of the outbreak. The predicted trajectory (green-solid) forecasts the daily growth of 100 days after the end of the study period (III).
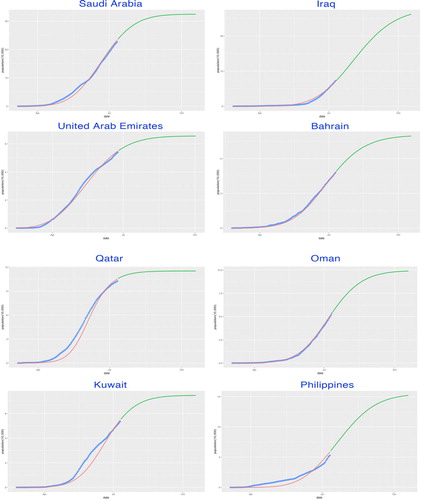
Figure 12. SIR-X model fitting by countries. The fitted growth curve (red-solid, smooth) and the actual growth curve (blue-solid, discretised) of daily confirmed cases over the ongoing dates of the outbreak. The predicted trajectory (green-solid) forecasts the daily growth of 100 days after the end of the study period (IV).
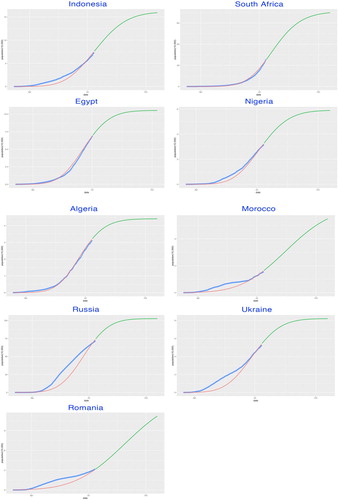
Table 3. Parameters of model SIR-X.