
Figures & data
Figure 1. All the chains show good estimation of covariance matrix. The estimators are better than both the sample covariance matrix and the PDSCE estimator.
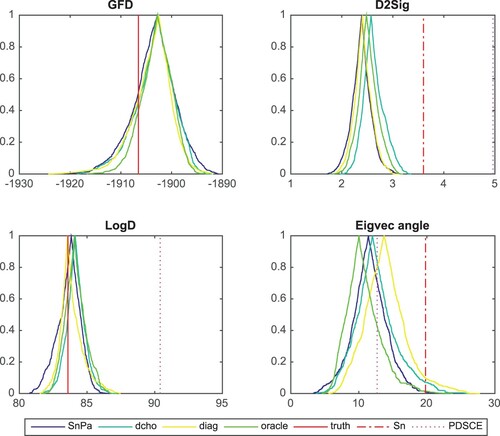
Figure 2. Similar to Figure , the fiducial estimators are better than both the sample covariance matrix and the PDSCE estimator in this case.
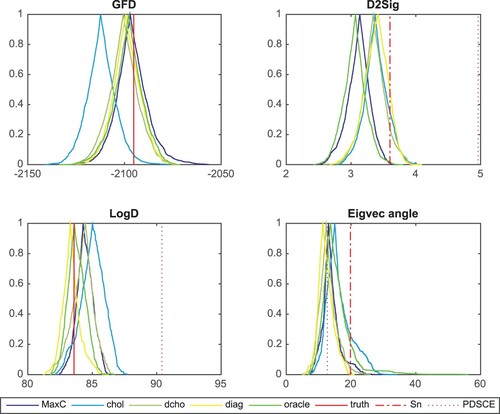
Figure 3. Result for k = 10, p = 200, n = 1000. The trace plot (top left) shows that the chains converge quickly. Although is small, the sample covariance (bottom left) roughly captures the shape of true covariance (top right). The last panel (bottom right) shows that the fiducial estimate captures the true clique structure perfectly.
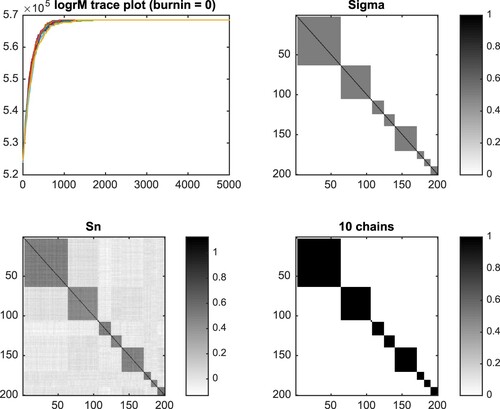
Figure 4. Confidence curve plots for estimated covariance matrix. k=10,p=200,n= 1000. Comparing to the sample covariance, the estimators are closer to Σ. The PDSCE estimator shows even smaller FM-distance to Σ, it, however, greatly overestimates .
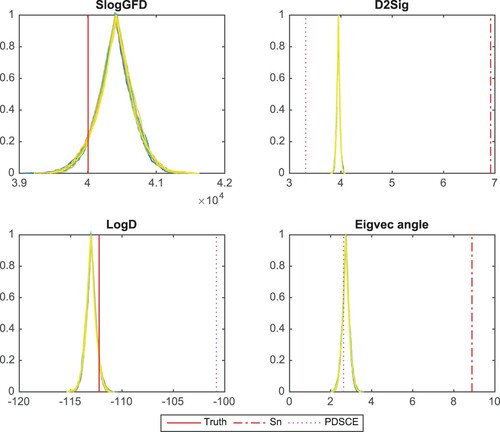
Figure 5. 95% coverage plots for 200 repeated simulations. k=10,p=200,n= 1000. The p-values (in green) roughly follow a uniform [0,1] distribution, and they lie inside of the envelope.
![Figure 5. 95% coverage plots for 200 repeated simulations. k=10,p=200,n= 1000. The p-values (in green) roughly follow a uniform [0,1] distribution, and they lie inside of the envelope.](/cms/asset/eb1e8be7-c3e5-4070-8760-5d5d13f6b865/tstf_a_1877950_f0005_oc.jpg)