
Figures & data
Table 1. Comparison of the homogeneous model (null model), the logistic regression model, the early stopping FNN and the GLM improved/regularised FNN.
Figure 1. Preliminary analysis exploring the early stopping rule: model fitting on the training data (in upper graph) and tracking over-fitting on the validation data
(in lower graph); note that this is a standard output in Keras which (unfortunately) drops the factor 2 from the loss function (Equation7
(7)
(7) ), thus, the y-axis needs to be scaled with 2.
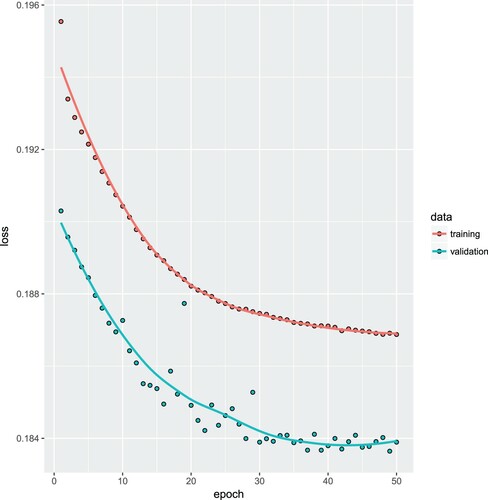
Figure 2. (lhs) Balance property (Equation4(4)
(4) ) of the early stopping FNN over 50 different seeds (starting points), the orange horizontal line shows the balance property of 5.007276%; (middle) in-sample learning losses on
and (rhs) out-of-sample test losses on
of the early stopping FNN (left box plots in graphs) and the GLM improved/regularised FNN (right box plots in graphs) over the 50 different seeds (starting values of the SGD algorithm).
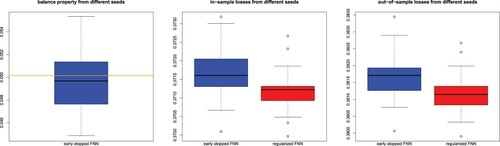
Table 2. Comparison of the homogeneous model (null model), the logistic regression model, the early stopping FNN and the GLM improved/regularised FNN, shrinkage regularised versions for different tuning parameters .