Figures & data
Figure 1. The empirical density of under
and the density of
.
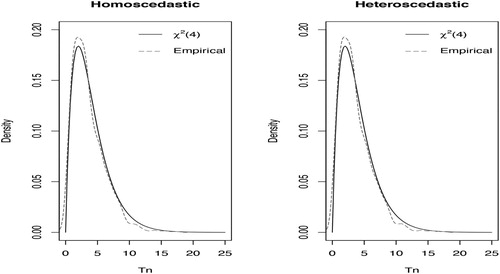
Figure 2. Power of tests based on and
for testing the partial tail independence between X and Y given Z.
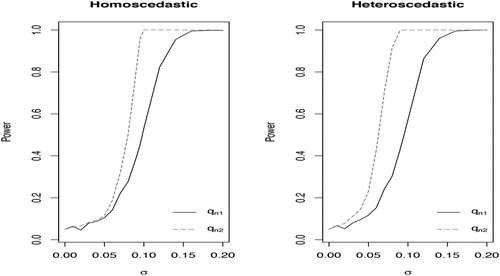
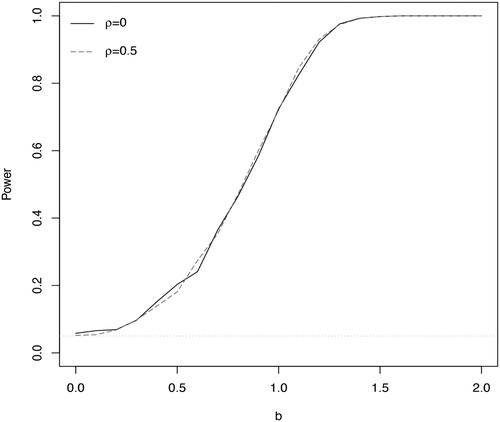
Figure 3. Power curve of the test based on the maxima of maxima theory for high-dimensional inference with two phenotype. The parameter ρ corresponds to the correlation used in the simulation. The x-axis represents the deviation from the null hypothesis. The horizontal line dotted corresponds to the 0.05 nominal level.