
Figures & data
Figure 1. The simulated over varying coefficients of covariates. (a) Example 5.1 and (b) Example 5.2.
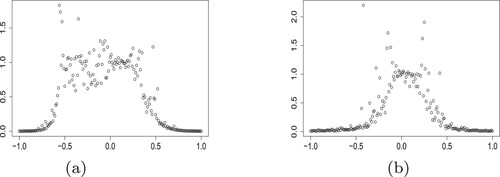
Table 1. The individual information in real data analysis.
Figure 2. Histograms of reporting delays (in days): (a) Female, Region III, age 9–20; (b) Male, Region I, age 45–50; (c) Male, Region VI, age 20–40; (d) Male, Region III, age >55.
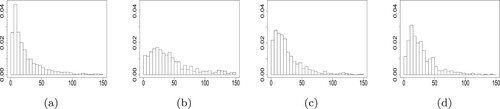
Figure 3. Histograms of settlement delays (in days): (a) Female, Region III, age 9–20; (b) Male, Region I, age 45–50; (c) Male, Region VI, age 20–40; (d) Male, Region III, age >55.
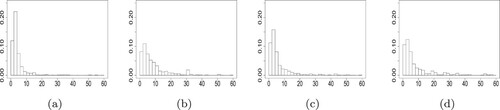
Table 2. Estimated parameters for reporting developments, their standard errors and p-values.
Table 3. Estimated parameters for settlements developments, their standard errors and p-values.
Table 4. Estimated parameters for payments, their standard errors and p-values.
Table 5. Reserving, accuracy of prediction and accuracy improvement of IIM with respect to IDM.