
Figures & data
Figure 1. Expected rewards for arms in the simulation experiment 1.
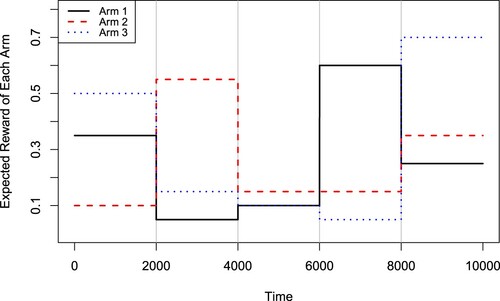
Figure 2. Expected cumulative regrets for the M-UCB and RCD-UCB with different α values in the simulation experiment 1.
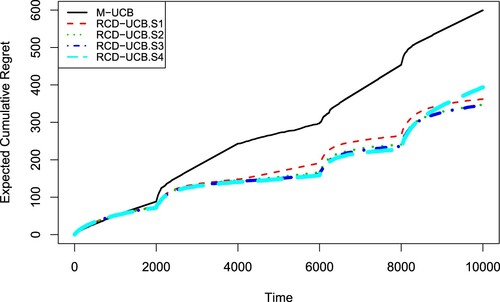
Figure 3. Expected rewards for arms in simulation experiment 2.
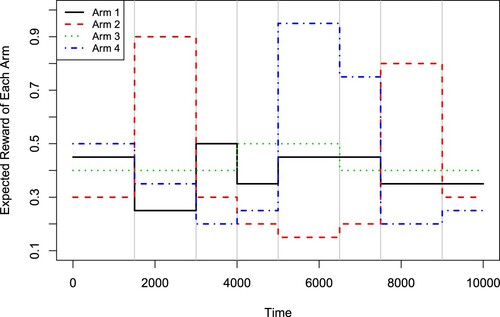
Figure 4. Expected cumulative regrets for M-UCB and RCD-UCB with different α values in the simulation experiment 2.
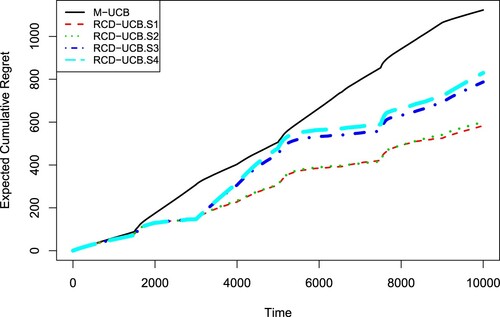
Table 1. Average number (AVE) and standard deviation (SD) of detected change points by each algorithm in the simulation experiment 1.
Table 2. Average cumulative regrets (AVE), standard deviations (SD) and computational time in seconds (TIME) for different algorithms in the simulation experiment 1.
Table 3. Average number (AVE) and standard deviation (SD) of detected change points by each algorithm in the simulation experiment 2.
Table 4. Average cumulative regrets (AVE), standard deviations (SD) and average computational time in seconds (TIME) for different algorithms in the simulation experiment 2.
Table 5. Average number (AVE) and standard deviation (SD) of detected change points by each algorithm in the simulation experiment 3.
Table 6. Average cumulative regrets (AVE) and standard deviations (SD) by each algorithm in the simulation experiment 3.
Figure 5. Average rewards for arms in the elongation data analysis.
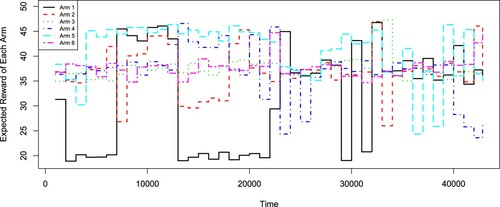
Figure 6. Cumulative regrets for different algorithms in the real data analysis.
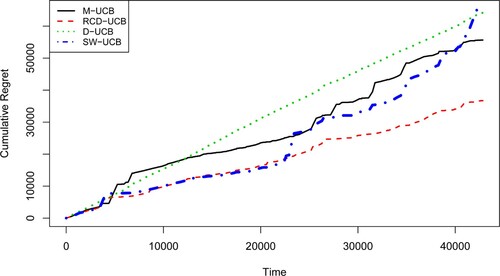
Table 7. Cumulative regrets for different algorithms in the elongation data analysis.