Figures & data
Table 1. Simulated type I errors.
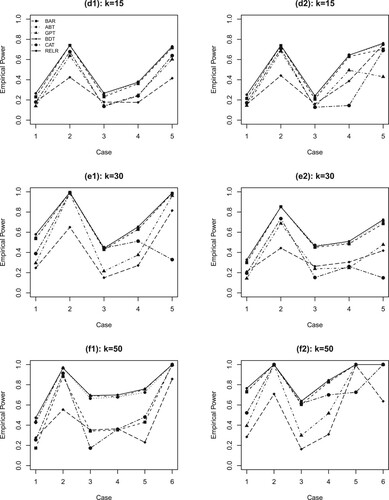
Figure 1. Simulation results for Settings (k = 2, 5, 10) corresponding to various cases. BAR: Bartlett's test (red line with filled square); ABT: Ma et al.'s test ; GPT: Liu & Xu's test; BDT: Bhandary & Dai's test; CAT: Gokpinar & Gokpinar's test; and LRT.
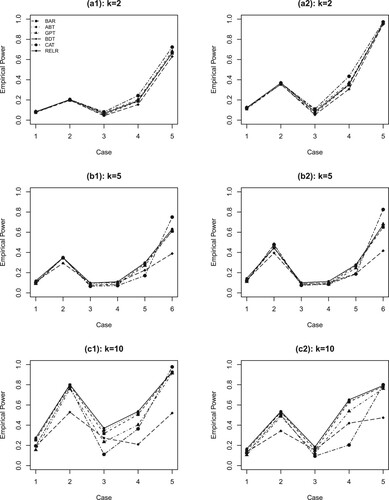
Figure 2. Simulation results for Settings (k = 15, 30, 50) corresponding to various cases. The caption is the same as in Figure .