Figures & data
Table 1. Comparison of the rejection rates of five methods in Model 1 for ,
,
and the sample size
, based on 5000 replications.
Table 2. Comparison of the rejection rates of five methods in Model 2 for ,
,
and the sample size
, based on 5000 replications.
Table 3. Comparison of the rejection rates of five methods in Model 3 for ,
,
and the sample size
, based on 5000 replications.
Figure 1. The relationship between the rejection rates of ,
,
,
,
and the true coefficient
in Model 1
a single abrupt point model
. The abrupt point
,
. The true parameter
increases gradually from 0.1 to 0.9. (a) The sample T = 60; (b) the sample T = 200.
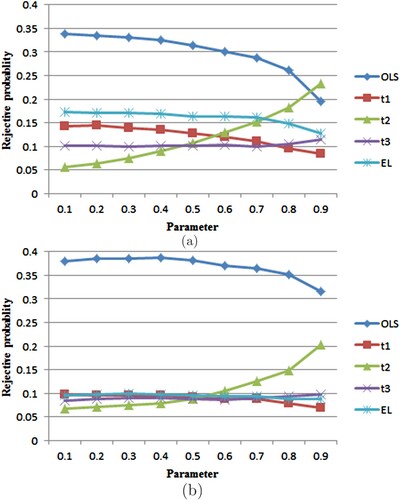
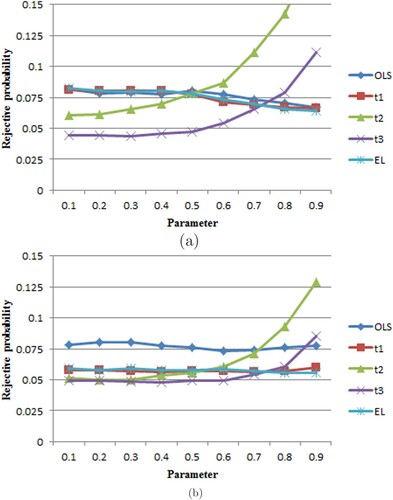
Figure 2. The relationship between the rejection rates of ,
,
,
,
and the true coefficient
in Model 2
two abrupt points model
. The abrupt points
,
,
. The true parameter
increases gradually from 0.1 to 0.9. (a) The sample T = 60; (b) the sample T = 200.
![Figure 2. The relationship between the rejection rates of OLS, t1, t2, t3, EL and the true coefficient β1 in Model 2 (two abrupt points model). The abrupt points κ1=0.1, κ2=0.9, [σ0,σ1,σ2]=[0.2,5,0.2]. The true parameter β1 increases gradually from 0.1 to 0.9. (a) The sample T = 60; (b) the sample T = 200.](/cms/asset/8ca5d0a9-b685-4bfa-921f-f47d8eb4c136/tstf_a_1913977_f0002_oc.jpg)
Figure 3. The relationship between the rejection rates of ,
,
,
,
corresponding to the true coefficient
in Model 3
continuous function variance model
, and m = 1,
. The true parameter
increases gradually from 0.1 to 0.9. (a) The sample T = 60; (b) the sample T = 200.