Figures & data
Figure 1. The curves are fitted when p = 0.5 and the true curves are the solid lines. Graph (a): Gamma prior, Ga(), for δ with
and
(dash-dotted),
(dotted),
(dashed); Graph (b): Scaled Pareto prior for η with c = 0.05 (dash-dotted), c = 0.1 (dashed) and c = 0.5 (dotted).
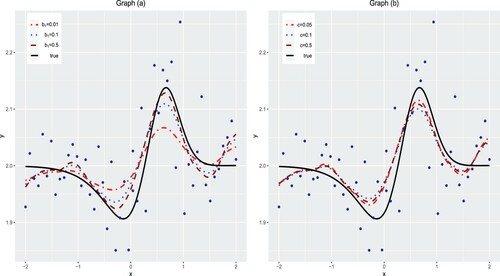
Table 1. ISEs for Gamma prior on δ and scaled Pareto prior on η.
Table 2. MIAEs and MISEs for Curve I with p = 0.1, 0.3 and 0.5.
Table 3. MIAEs and MISEs for Curve II with p = 0.1, 0.3 and 0.5.
Figure 2. The curves are fitted for Curve I under p = 0.3 and ALD error. Graph (a) NBQSS method; Graph (b) OBQSS method; Graph (c) QSS method; Graph (d) BSS method; Graph (e) SS method. The solid lines are the true curve and the fitted curve. Two dashed lines are 2.5% and 97.5% pointwise empirical quantiles.
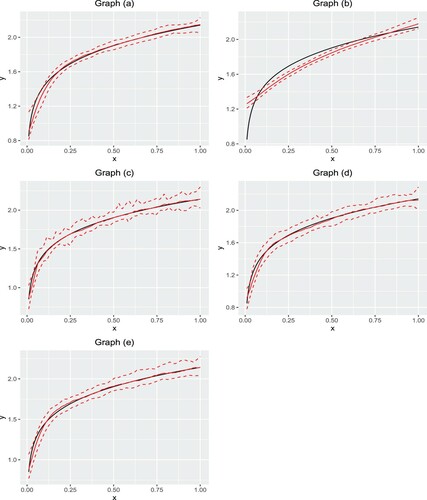
Figure 3. The curves are fitted for Curve II under p = 0.3 and ALD error. Graph (a) NBQSS method; Graph (b) OBQSS method; Graph (c) QSS method; Graph (d) BSS method; Graph (e) SS method. The solid lines are the true curve and the fitted curve. Two dashed lines are 2.5% and 97.5% pointwise empirical quantiles.
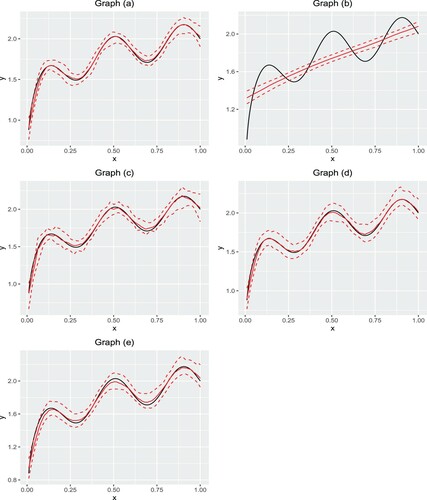
Figure 4. One illustration for Mechanisms I and II. Graphs (a)–(c) correspond to Mechanism I with and 70%. Graphs (d) and (e) correspond to Mechanism II with
30%, 50% and 70%.
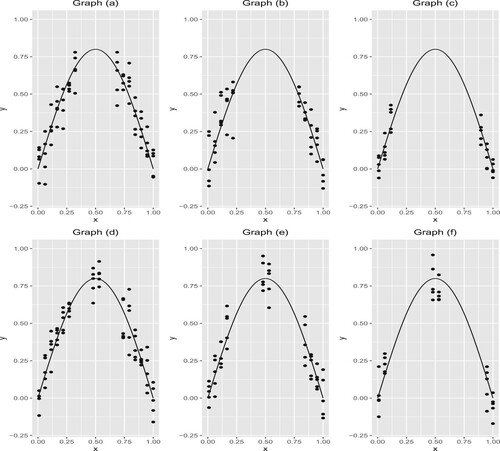
Table 4. MIAEs and MISEs for Mechanism I with quantiles p = 0.1, 0.5, 0.9 and unobserved proportions .
Table 5. MIAEs and MISEs for Mechanism II with quantiles p = 0.1, 0.5, 0.9 and unobserved proportions .
Table 6. Summary of cases where NBQSSK outperforms NBQSS.
Figure 5. The solid lines are the true curve and fitted curves. The curves are fitted with p = 0.1, ALD random error. Dashed lines are empirical 95% credible interval corresponding to NBQSSK and dotted lines are empirical 95% credible interval corresponding to NBQSS. Graph (a): Mechanism I, ; Graph (b): corresponds to Mechanism II,
; Graph (c): Mechanism I,
; Graph (d): Mechanism II,
.
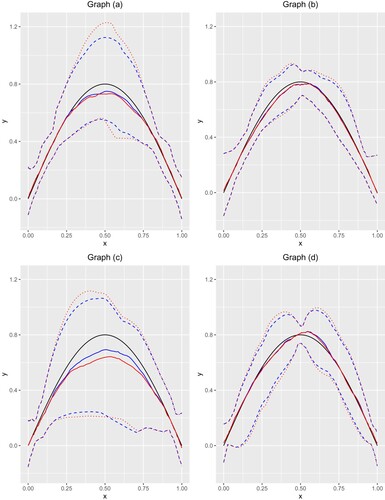
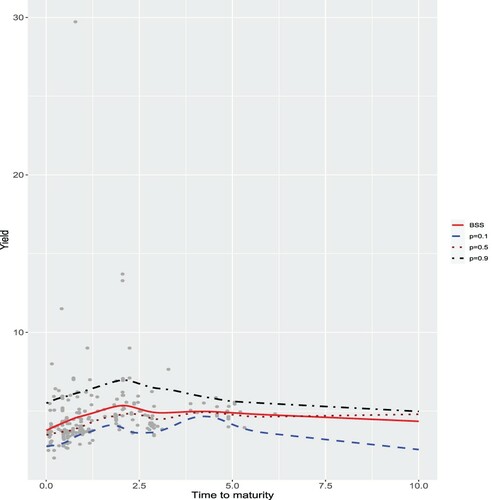
Figure 6. Graph (a): NBQSS method with p = 0.1, 0.5 and 0.9; Graph (b): OBQSS method with p = 0.5; Graph (c): BSS method; Graph (d): SS method.
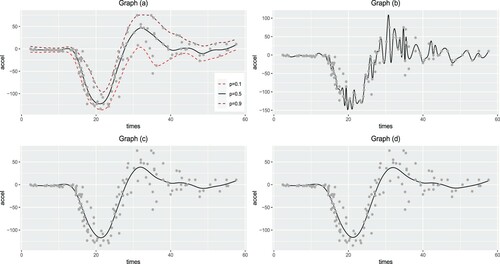
Figure 7. BSS curve (solid) and NBQSS with 0.1 (dashed), 0.5 (dotted) and 0.9 (dotted-dash) curves on 25 September 2018.