
Figures & data
Table 1. Coverage probabilities (%) of the Wald and ELR confidence intervals with .
Table 2. Coverage probabilities (%) of the Wald and ELR confidence intervals with .
Figure 1. Rejection probabilities of the ELR (dashed line) and Wald (solid line) tests in Scenarios (A1) and (A2) (First row), and (A3) and (A4) (Second row) of Example 3.1.
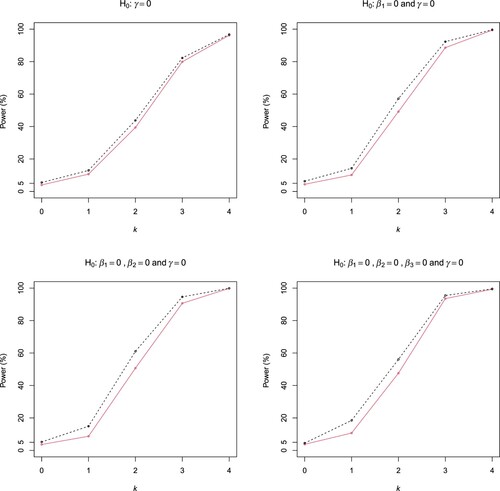
Figure 2. Rejection probabilities of the ELR (dashed line) and Wald (solid line) tests in Scenarios (B1) and (B2) (First row), and (B3) and (B4) (Second row) of Example 3.2.
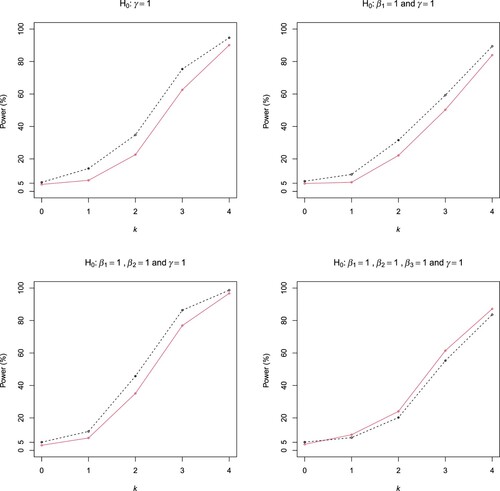
Table 3. Rejection probabilities (%) of model checking of Examples 3.3 and 3.4.
Table 4. IH and outcome for Wilms tumour.
Figure 3. Histograms of Age in different combinations of outcome (Row 1, relapses or cases; Row 2, non-relapses or controls) and the stratum variable (IH; Column 1, unfavourable; Column 2, favourable).
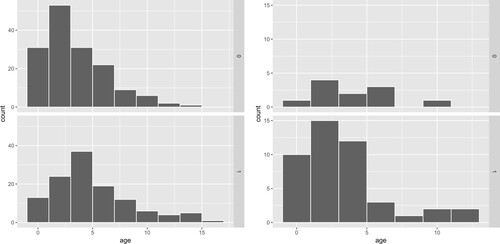
Table 5. Results of regression parameter estimates in Wilms tumour study.