Figures & data
Figure 1. An example of a tree structure , which is a directed graph with random variables at the nodes (marked as circles). Entries of the kth column of Z,
's, are at the leaves. The lengths of all edges of
,
's and
's, are marked on the figure. In particular,
's represent the lengths between each leaf (
, shaded nodes) and its parent node (
, dotted nodes). The total edge lengths
is the summation of the lengths of all edges of
. In this example,
. The condition in case (2) of Lemma 3.3 in Section 3 means
for some
.
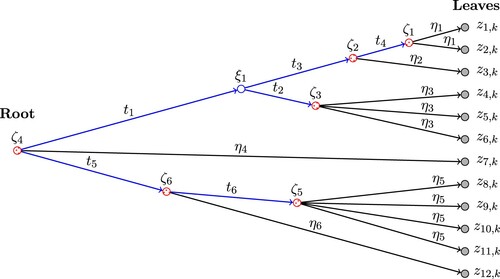
Table 1. Simulation results for different combinations of n and p.
Figure 2. Simulation results for different combinations of n and p. Plot of versus n, where
is the spectral norm for the residual of the similarity matrix, and
is the posterior contraction rate defined in Theorem 3.4. The ratio converges to zero as n increases, demonstrating the theoretical results. The vertical error bars represent one standard error.
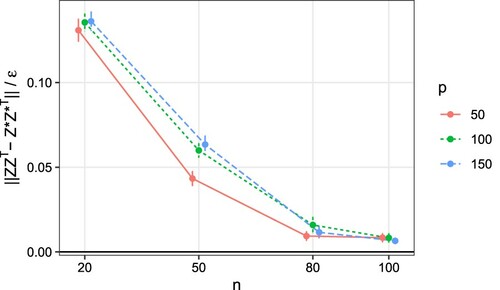
Table 2. Simulation results for different s.
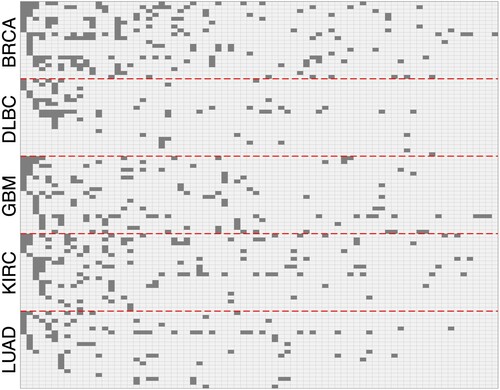
Figure 3. The inferred binary feature matrix for the TCGA RPPA dataset. The dataset consists of 100 patients, with 20 patients for each of the 5 cancer type, BRCA, DLBC, GBM, KIRC and LUAD. A shaded gray rectangle indicates the corresponding patient j possesses feature k, i.e., the corresponding matrix element
. The columns are in descending order of the number of objects possessing each feature. The rows are reordered for better display.