Figures & data
Table 1. Comparison of the mean-standard deviation-ratio and the variance estimator ratio at the 5% level with and p = 100, 200, 400, 800, 1200.
Figure 1. ROC curves of the involved tests under the three scenarios with .
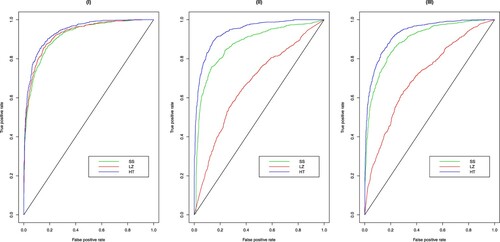
Table 2. Empirical size and power comparison at the 5% level with and p = 100, 200, 400, 800, 1200.
Table 3. Empirical size and power comparison at the 5% level with and p = 100, 200, 400, 800, 1200.
Table 4. Empirical size and power comparison at the 5% level with and p = 100, 200, 400, 800, 1200.
Table 5. Empirical size comparison at the 5% level with the MA(2) covariance matrices with , 20, 30 and p = 100, 200, 400, 800, 1200.
Table 6. Empirical power comparison at the 5% level with the MA(2) covariance matrices with , 20, 30 and p = 100, 200, 400, 800, 1200.
Figure 2. Histograms of the p-values of the normality tests and the gene expression means, for the tumour group and the normal group, respectively.
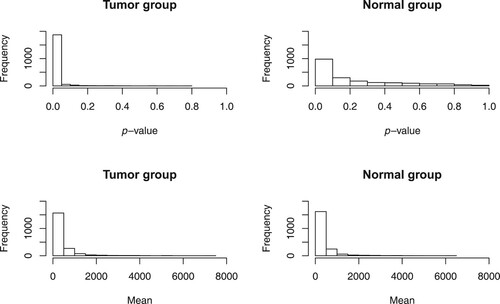
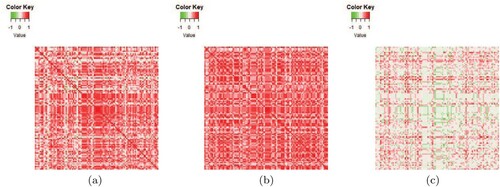
Figure 3. Heatmaps of the sample correlation matrices of the two groups as well as the difference of the two matrices, which are constructed via the first 100 genes in the original data. (a) Normal group, (b) tumour group and (c) difference of two groups.