
Figures & data
Table 1. Probabilities of QTL genotypes.
Table 2. Type I errors (%) and standard errors (%) of the five methods.
Table 3. Powers (%) of the five methods for Normal mixture model.
Table 4. Powers (%) of the five methods for Logistic mixture model.
Table 5. Powers (%) of the five methods for mixture model under .
Table 6. p-values of Shapiro–Wilk test.
Figure 1. The trace plot of Markov chains of the four generalized p-values methods for D1Mit156-D1Mit178.
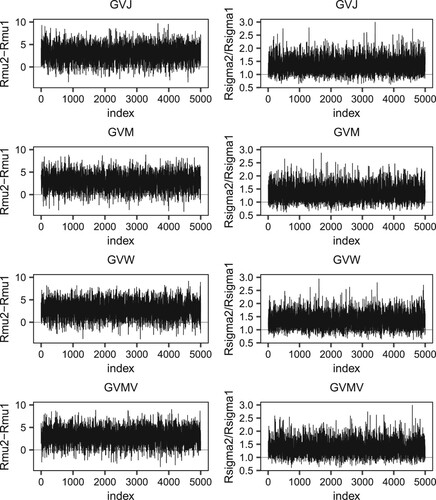
Table 7. Sample sizes of 10 intervals.
Figure 2. The boxplot of and
for D1Mit267-D1Mit15.
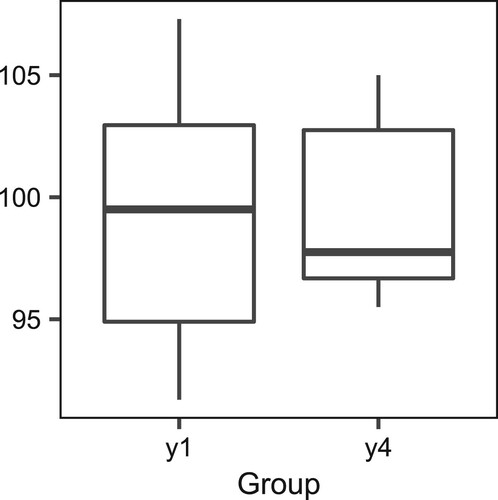
Table 8. Five kinds of p-values in 10 intervals.
Table 9. Five kinds of p-values in 10 intervals under assumption.