Figures & data
Table 1. The eight predictive powers with historical and interim data, their analytical expressions, the predictive distributions, the data used, and the references for the hypotheses versus
.
Table 2. The eight predictive powers with historical and interim data, their analytical expressions, the predictive distributions, and the data used for the reversed hypotheses versus
.
Figure 1. The data structures of the historical data, interim data and future data.
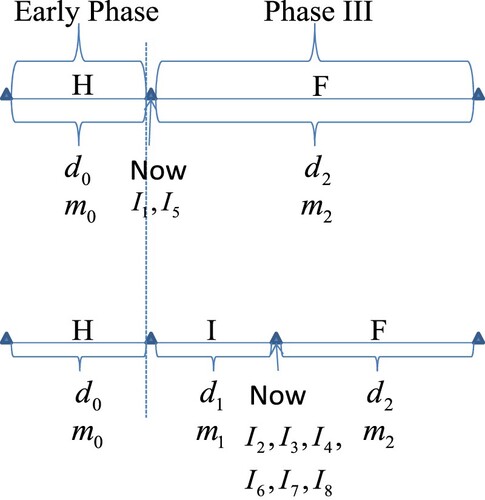
Table 3. The eight predictive powers with historical and interim data of eventual conclusions for the B-14 trial after the first interim analysis in 1993. Two prior distributions are considered: a sceptical prior and an optimistic prior.
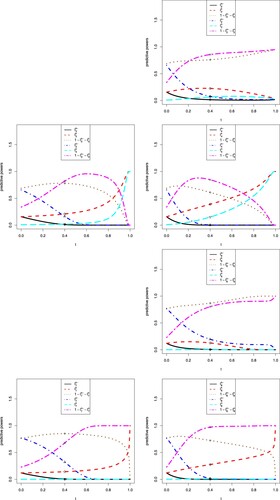
Figure 2. The sensitivity analysis of on the eight predictive powers.
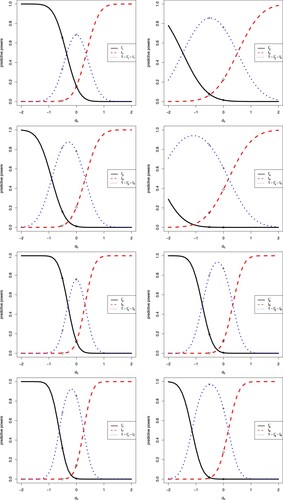
Figure 3. The sensitivity analysis of on the eight predictive powers.
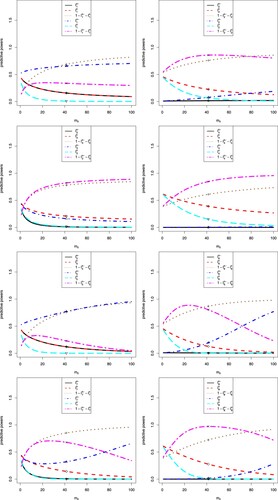
Table 4. The increase–decrease characteristics of ,
,
,
,
and
for
observed from Figure .
Figure 4. The sensitivity analysis of on the eight predictive powers.
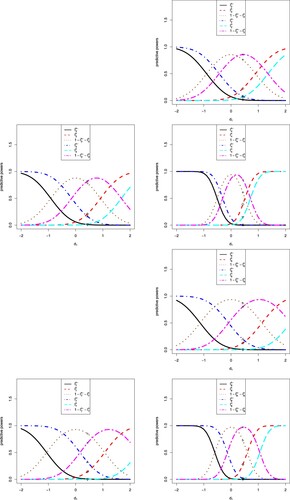
Figure 5. The sensitivity analysis of on the eight predictive powers.
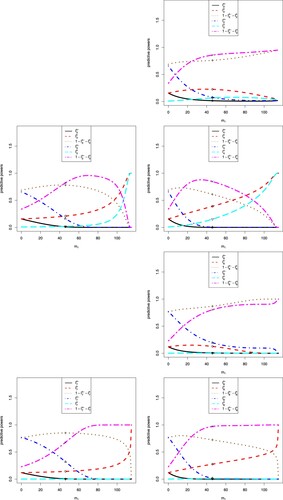
Table 5. The increase–decrease characteristics of ,
,
,
,
and
for i = 2, 3, 4, 6, 7, 8 observed from Figure .
Figure 6. The sensitivity analysis of on the eight predictive powers.
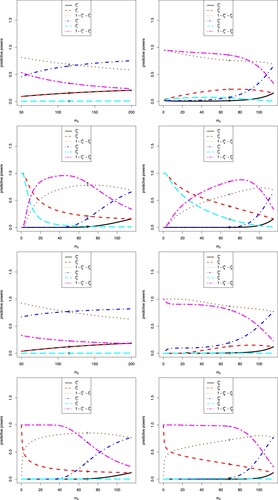
Table 6. The increase–decrease characteristics of ,
,
,
,
and
for
observed from Figure .
Figure 7. The sensitivity analysis of t on the eight predictive powers.