
Figures & data
Table 1. Simulations results of the KL loss for setting 1.
Figure 1. The means of ratio by methods of OPT1-KL and OPT2-KL with .
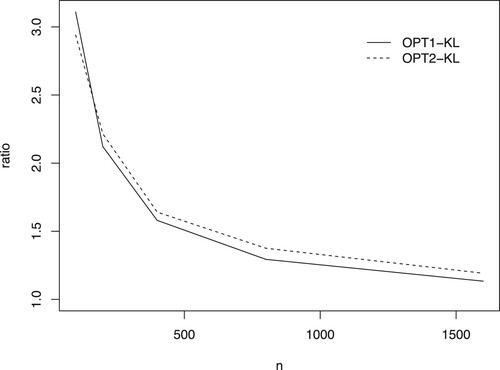
Table 2. Simulation results of MSFE.
Table 3. Simulations results of the KL loss for setting 2.
Figure 2. The relationship between the mean of KL loss and . The points with the smallest losses are indicated by the filled circle •. (a) n = 100 and (b) n = 200.
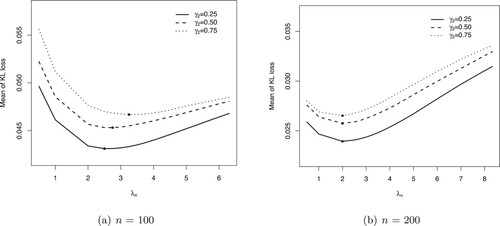
Table 4. Simulations results of the KL loss for setting 3.
Table 5. Simulations results of the KL loss for setting 4.
Table 6. Simulations results of MSFE for setting 4.
Figure 3. Assessing the estimation consistency of OPT1-KL and OPT2-KL. (a) case 1 and (b) case 2.
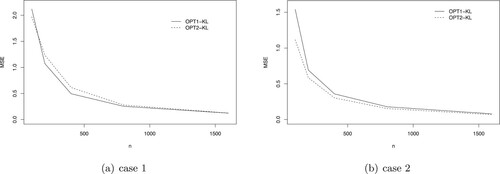
Figure 4. Boxplots of KL-type prediction losses by seven methods in the website phishing data.
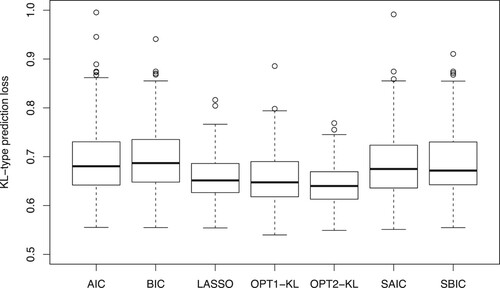
Table 7. Out-of-sample performances in the website phishing data.
Table 8. Diebold–Mariano statistics of hit-rate in the website phishing data.