Figures & data
Figure 1. Plots based on Example 1.
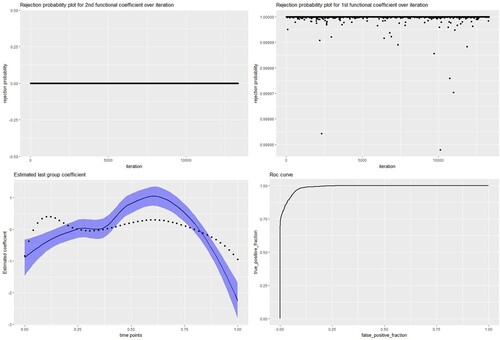
Table 1. Classification and selection performance table.
Table 2. Patients baseline characteristics.
Figure 2. Brain volume changes of Left Hippocampus, Left Lateral Orbitofrontal cortex, and Left Posterior Cingulate over time for Normal and Dementia patients.
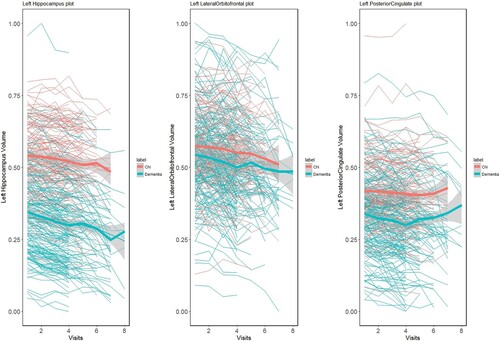
Figure 3. Acceptance probability of MCMC sample for Left Hippocampus and Left-Lateral Orbitofrontal brain regions.

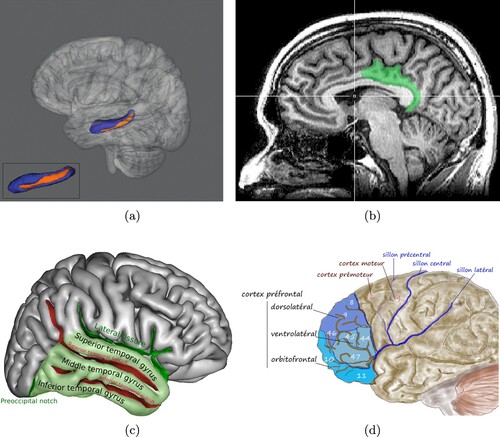
Figure 4. Pictorial representation of selected brain ROI's discriminating diseased group from normal control. (a) Left Hippocampusa. (b) Posterior Singulatea. (c) Middle Temporal Gyrusa and (d) Left lateral orbitofrontal cortexa.
a Plot obtained from on-line resources.