
Figures & data
Table 1. Three penalty functions are used for variable selection procedure.
Table 2. Simulation results of the parameters of scale, skewness and mixing proportion for =0.5.
Table 3. Varying skewness with n = 400 and .
Table 4. Varying sample size n with ,
and
.
Figure 1. Histogram of the BMI.
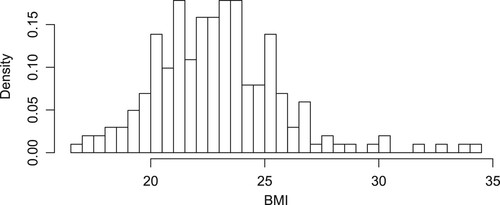
Figure 2. Clustering results for the BMI data obtained. (a) The 4 clusters at level 3. (b) The ascending paths from the modes at level 3 to those at level 4 and the contours of the density estimate at level 4. (c) The 2 clusters at level 4. (d) The ascending paths from the modes at level 4 to the next level and the contours of the density estimate at the next level.
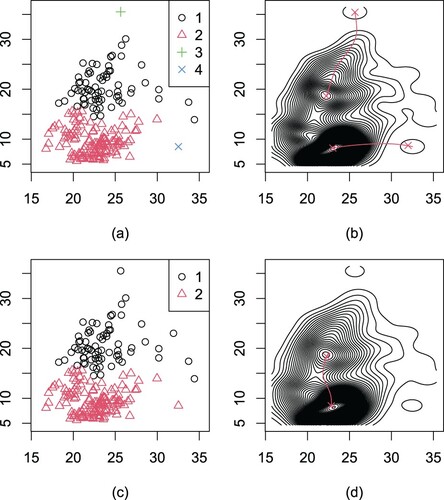
Table 5. Variable selection for BMI data set via FMMeR model.
Table 6. Variable selection for BMI data set via finite mixture of MODLR model.
Table 7. Variable selection for BMI data set via NMR model.