
Figures & data
Table 1. The means of Absolute Bias, MSE (standard deviation) and t for simulation Example 1.
Figure 1. Comparison of MSE versus the number of blocks M with for three methods for simulation Example 3.2.
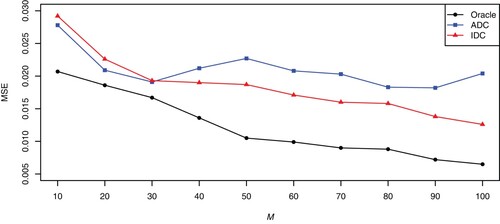
Figure 2. The mean computing time of (in seconds) for simulation Example 3.2.
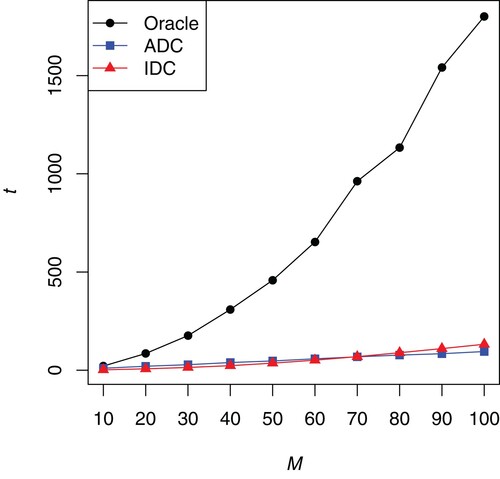
Table 2. The means of Absolute Bias (standard deviation) and t for simulation Example 3.
Figure 3. Estimated single index function for the combined cycle power plant data. The dots are the observations EP and the curve is the estimated EP by the Oracle method.
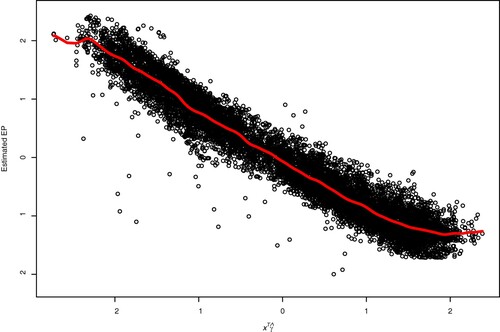
Table 3. The coefficient estimates and MSFE for the combined cycle power plant data.
Table 4. The coefficient estimates and MAPE for the airline on-time data.