Figures & data
Figure 1. Spatial distribution of rainfall stations.
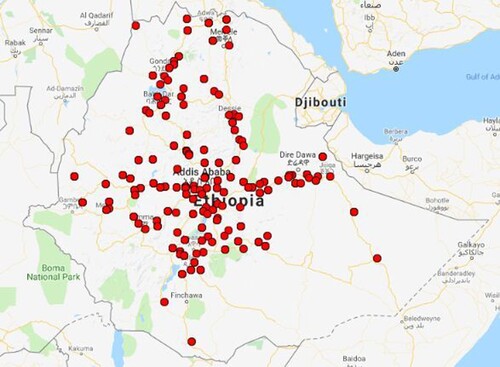
Figure 2. Flow chart of data analysis steps.
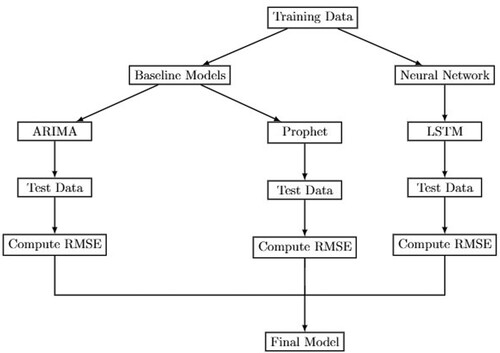
Figure 3. Single layer preceptron.
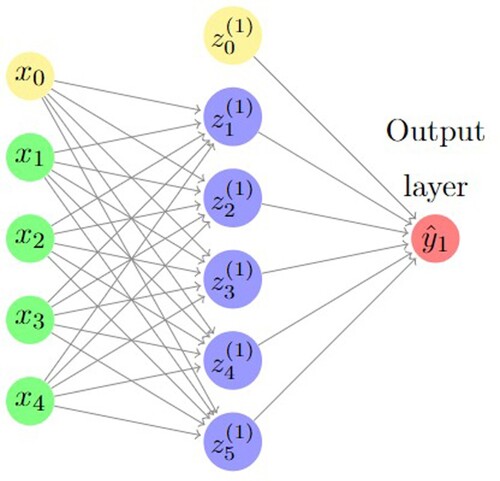
Figure 4. A multilayer preceptron with two hidden layers.
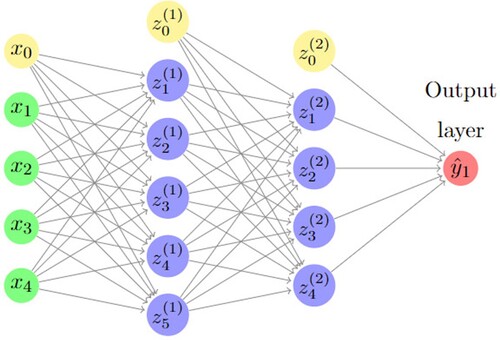
Figure 5. Illustration of an LSTM architecture.
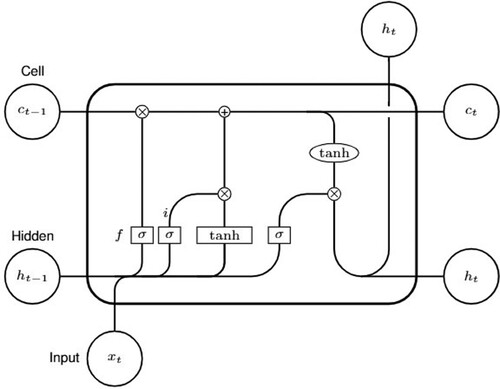
Table 1. Matrix of BOW representation for the rainfall data.
Figure 6. Spatial distribution of homogenized rainfall stations.
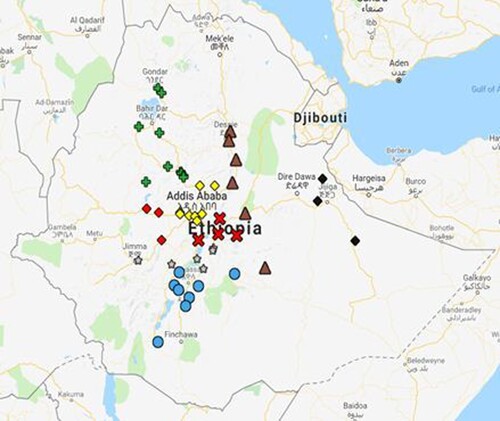
Figure 7. Time series plot of region 1.
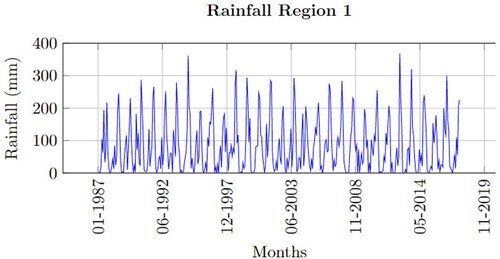
Table 2. Skewness and coefficient of variation.
Figure 8. Monthly median of rainfall regions.
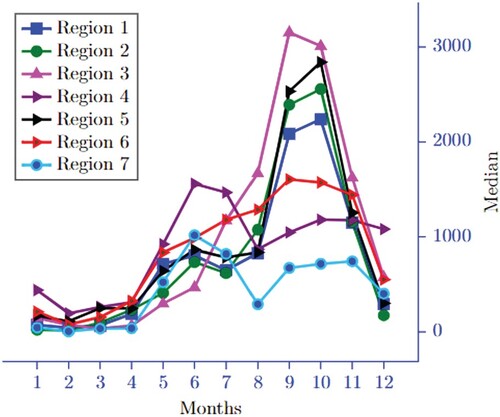
Table 3. ARIMA and prophet models for the rainfall data.
Table 4. ARMA models' test of stationarity and invertibility.
Table 5. LSTM model.
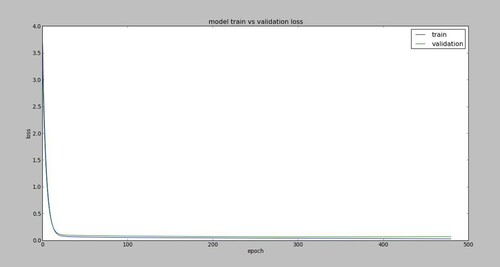
Figure 9. A plot of loss for the LSTM model of region 1.