Figures & data
Table 1. Number of tests and number of individuals testing positive for passengers and crews on the Diamond Princess cruise ship, Yokohama, Japan, February 2020 (n = 3711).
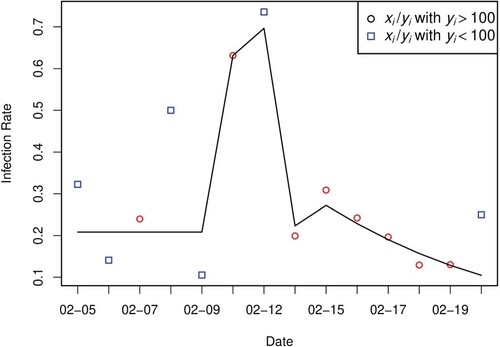
Figure 1. Comparison of the observed detection rates and estimated ones if the selection bias is ignored.
represents number of patients that were tested positive at day i, and
is the total number of tests at day i. Scatter points are the rate of
, where red and blue colours differentiate whether
or not. Black line shows the estimated detection rates
.
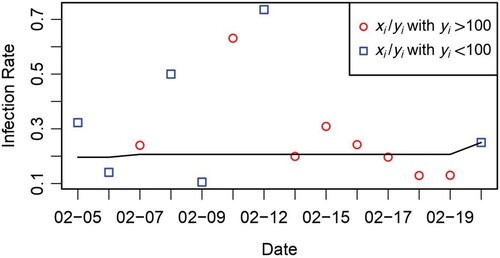
Table 2. Simulation results.
Table 3. MLEs and the corresponding confidence intervals in real data analysis.
Figure 2. Comparison of the observed detection rates and fitted ones based on the proposed nonparametric mixture model.
represents number of patients that were tested positive at day i, and
is the total number of tests at day i. Scatter points are the rates of
, where red and blue colours differentiate whether
or not. Black line shows the fitted detection rates
.