
Figures & data
Table 1. Some functions under two link functions.
Table 2. Specifications of under p = 2, 3 and two link functions.
Table 3. Type-I errors (in %) of the global test (for the model significance) and individual test (for the significance of the covariates) under two types of responses, two link functions and various sample sizes.
Table 4. ERMSE, CR and testing power of β's of models considered in Table with various sample sizes.
Table 5. Rejection rates (in %) of Wilding et al. (Citation2011)'s method and the proposed method for testing the significance of the covariate.
Figure 1. (a) Correlation of PCS and MCS over 20 age groups, (b) correlation of PCS and MCS over 20 age groups with different genders, (c) correlation of PCS and MCS over 20 age groups with different marital status.
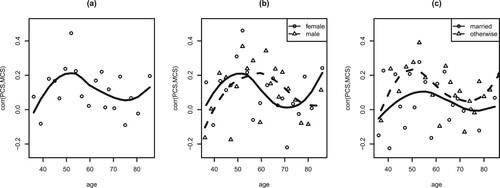
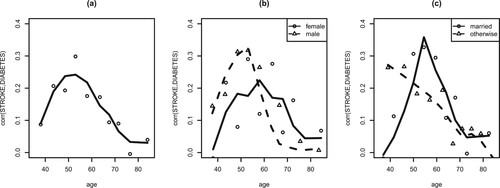
Figure 2. (a) Correlation of STROKE and DIABETES over 10 age groups, (b) correlation of STROKE and DIABETES over 10 age groups with different genders, (c) correlation of STROKE and DIABETES over 10 age groups with different marital status.
Data availability statement
The data that support the findings of this study are available from the corresponding author upon request.