
Figures & data
Table 1. Relative biases and relative standard errors of estimated parameters, for and 1.
Table 2. Relative biases and relative standard errors of estimated parameters, for and 2.
Figure 1. Box-plots of corresponding to
(first row), 1.5 (second row), and 2 (third row), respectively, where the dashed line indicates the critical value 3.84, and the number at the right side of the figure is the proportion that
. In the last piece, all
's are much larger than 3.84, and thus the dashed line and the rejection proportion are not shown in the figure.
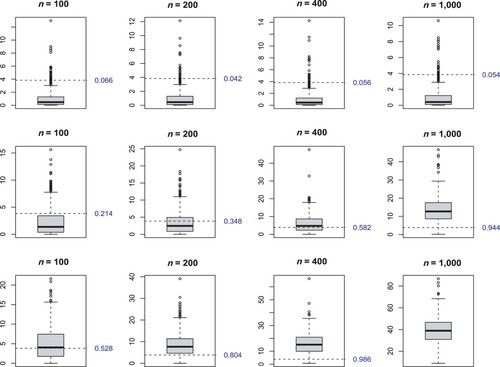
Table 3. Proportion of replicates that the Yule-Simon distribution is rejected at nominal level 0.05.
Table 4. Comparison of actual distribution (A) with discrete Pareto law fitting (P), Waring fitting with EFF (E) and MLE (M).