
Figures & data
Figure 1. Plots of the density function for various parameter values.
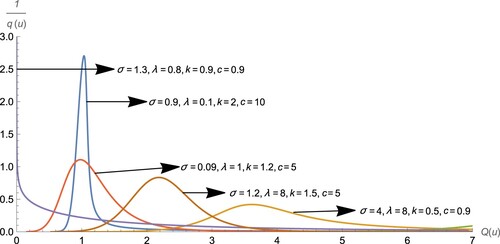
Figure 2. Plots of the hazard quantile function for various parameter values.
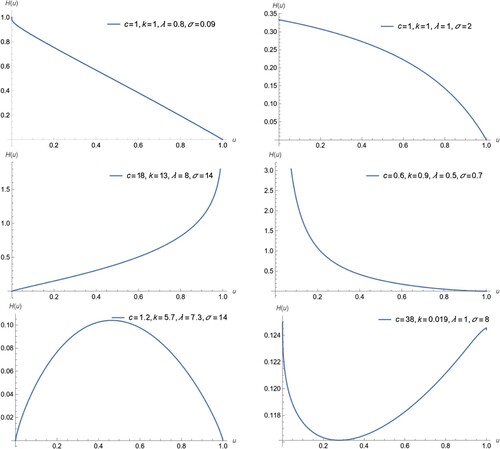
Table 1. The sample L-moment values for Dataset-1 and Dataset-2.
Table 2. The basic descriptive statistics of the two datasets.
Table 3. Goodness-of-fit statistics corresponding to the two datasets.
Figure 3. plot corresponing to LSE and MLM estimates for the first dataset.
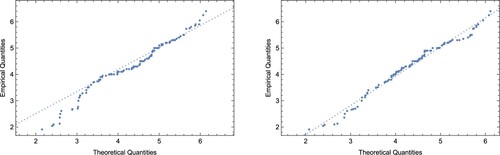
Figure 4. plot corresponing to LSE and MLM estimates for the second dataset.
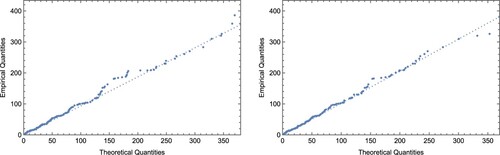
Table 4. The chi-square with p-values for the datasets.
Figure 5. (a) Hazard quantile plot of the first dataset. (b) Hazard quantile plot of the second dataset.
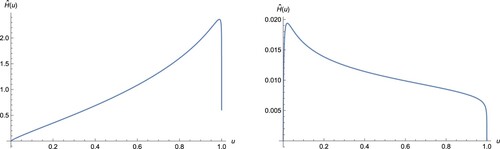
Figure 6. (a) Mean residual plot of the first dataset. (b) Mean residual plot of the second dataset.
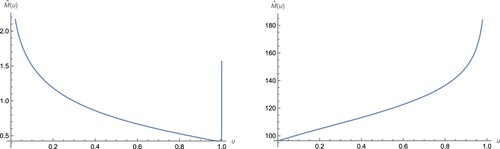
Figure 7. (a) The fitted density of the first dataset. (b) The fitted density of the second dataset.
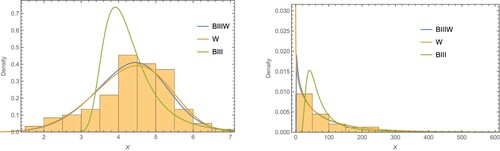
Table A1. Fracture toughness data of Alumina .
Table A2. Number of failures for the air conditioning system of jet airplanes.