
Figures & data
Figure 1. The number of people who came to the four Canadian provinces by air from January 2020 to April 2020. The sign 'o' is for Quebec, the sign '+' is for Ontario, the sign '*' is for Alberta and the sign '×' is for British Columbia.
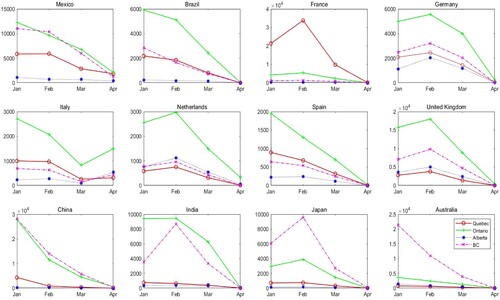
Figure 2. A flowchart of EAKF.
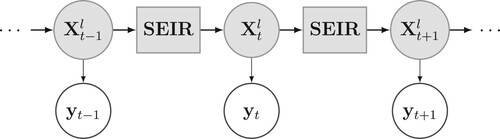
Figure 3. The time of the first documented COVID-19 case in each of the nine provinces: Ontario (ON), Quebec (QC), Alberta (AB), British Columbia (BC), Manitoba (MB), New Brunswick (NB), Saskatchewan (SK), Nova Scotia (NS), Newfoundland and Labrador (NL).
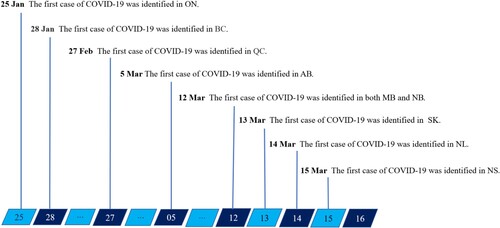
Figure 4. The fitting graph of the number of new cases per day in nine provinces, where the true number and the fitted values are plotted respectively in solid and dashed lines.
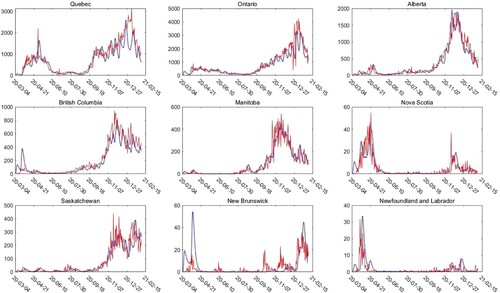
Figure 5. The numerical values of the four policy intensities in six provinces in Canada over time.
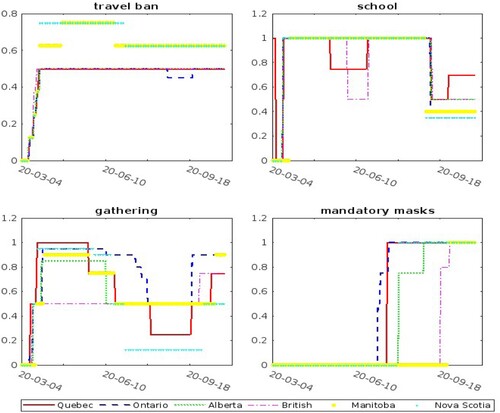
Table 1. The model parameter estimates of the six provinces – Quebec, Ontario, British Columbia, Alberta, Manitoba and Nova Scotia at three different phases.
Figure 6. The reproductive number , temperature and Google mobility data over time. The shaded part corresponds to the reproductive number, while the temperatures and Google mobility data are plotted respectively in red dashed line and blue solid line.
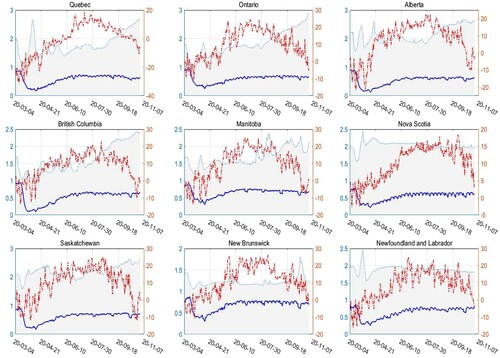
Figure 7. The predicted number of new cases in the four provinces with policy intensity lasting 80 days, 70 days, 60 days and 50 days, respectively.
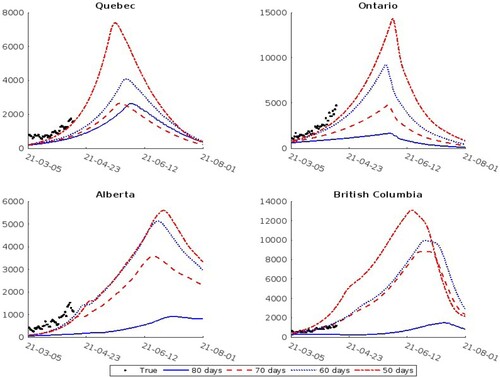
Figure 8. The predicted number of new cases in the four provinces with ,
,
and
of the policy intensity for 70 days, respectively.
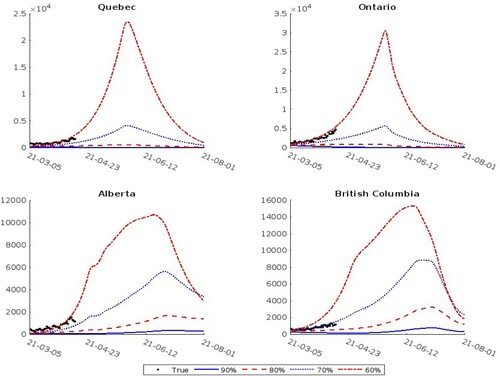
Table 2. The predicted errors in the four provinces with 70 of the policy intensities for different days (80, 70, 60, 50 days).
Table 3. The predicted errors in the four provinces with different policy intensities (90, 80
, 70
, 60
) for 70 days.