
Figures & data
Table 1. Descriptive statistics of macro data indicators.
Table 2. Descriptive statistics of micro data indicators.
Table 3. KMO test and Bartlett test results of macro-micro indicators.
Table 4. Eigenvalues and variance contribution of each principal component of macro-micro indicators.
Figure 1. Heat map of factor loading matrix.
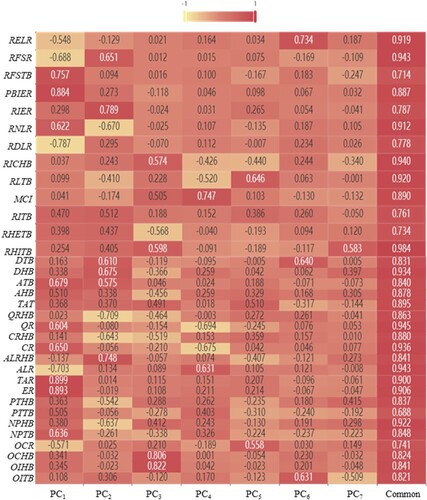
Table 5. Static and dynamic CAPM with the macro-micro big data sets.
Figure 2. Fitting diagram of the ridge regression model.
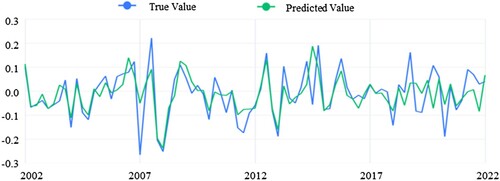
Figure 3. Feature importance histogram of decision tree and random forest.
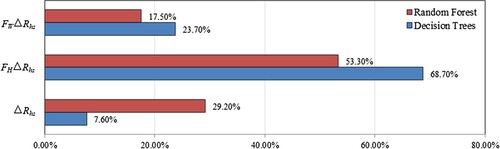
Table 6. Comparison of regression fit superiority between decision tree and random forest.
Figure 4. Time-series diagram of rural systemic risk beta value.
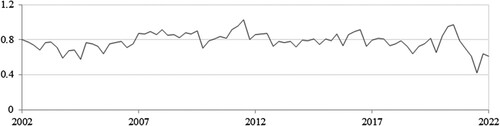
Table 7. Descriptive statistics of rural financial systemic risk β value.